November 8, 2026 · 14 min read · Pineflows team
Market Profile Traders: How to Read Auction Profiles

You're staring at a bar chart after a choppy session. You can see the high, the low, and where price closed, but you still can't tell which prices attracted sustained attention and which were passed through quickly. Market Profile organizes a session by price and time, giving you a different view of the same trading activity.
That's useful only if you resist turning the finished shape into a prediction. The disciplined approach is to write what you think buyers and sellers are doing, specify what would prove you wrong, and measure whether the resulting trade survives actual execution.
Table of Contents
- Market Profile in Plain Terms and Where It Came From
- TPO and Volume Profile Side by Side
- Reading Profile Shapes and Key Levels
- A Daily Market Profile Workflow
- Worked Examples from Opening Location to Trade Plan
- Testing Profile Setups Before Risking Capital
- Decide Whether Profile Analysis Fits Your Process
- Measuring the Gap Between Signal and Fill
Market Profile in Plain Terms and Where It Came From
Say price rallies, falls, and finishes near its opening level. A bar chart shows the journey, but the close alone doesn't tell you whether traders repeatedly returned to the middle or spent most of the session near the high.
A profile rearranges that activity into a sideways distribution. Wider rows show prices visited across more time brackets; narrow rows show comparatively little time-based participation. Market profile traders use that contrast to distinguish acceptance from rejection or rapid traversal.
Think of a crowded market. Customers keep gathering around a particular stall, while the nearby aisle stays almost empty. The gathering tells you where people are willing to conduct business, but it doesn't establish where they'll gather tomorrow.
From the Trading Floor to the Screen
According to the Market Profile historical overview, Chicago Board of Trade trader J. Peter Steidlmayer developed the framework from roughly 1959 to 1985, and the CBOT publicly introduced its Market Profile product, commonly identified as CBOTMP1, in 1985. That launch translated a pit-trading way of understanding auctions into a structured format available beyond the exchange floor.
The underlying idea is straightforward: buyers and sellers keep testing prices. Repeated activity suggests that participants are willing to transact there, while a brief visit suggests less established acceptance.
Futures day traders, equity traders watching the open, and analysts studying liquid markets can use this view alongside conventional charts. It doesn't replace the chronological record. It answers a different question about the session.
Practical rule: Treat a profile as a map of acceptance, not a forecast of the next move.
TPO and Volume Profile Side by Side
Do you want to know where time was spent or where volume changed hands? Choose the measurement before interpreting the shape.
| Feature | TPO (Market Profile) | Volume Profile |
|---|---|---|
| Measures | Time-based participation at each price | Executed volume at each price |
| Unit | A TPO for each price visited within a bracket | Contracts or shares traded |
| Point of control | Price with the most TPOs | Price with the most volume traded |
| Value area | A selected share of TPO activity | A selected share of executed volume |
| Best question | Where did the auction accept price over time? | Where did the most size change hands? |
| Weak spot | Doesn't measure trading intensity | Can emphasize fast, heavy bursts |
| Data needed | Price and time | Reliable exchange volume |
CQG's Market Profile documentation describes the commonly used 30-minute TPO bracket and the convention of a value area containing approximately 70% of activity, measured using the selected profile basis.
The distinction is easier to see visually.
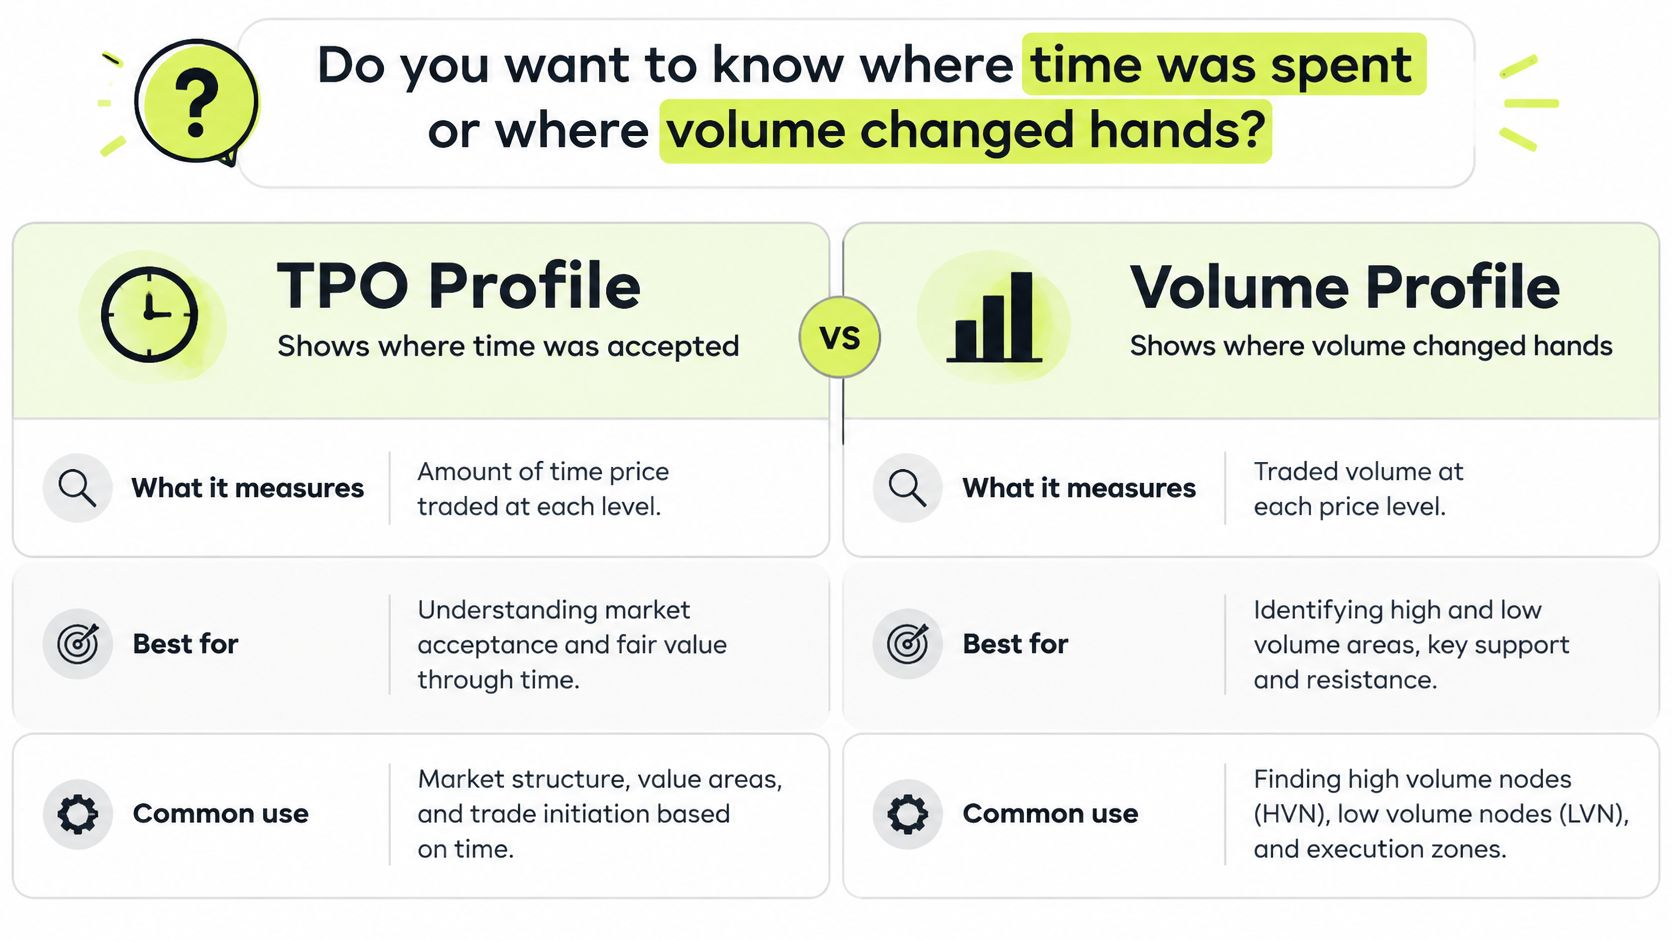
What Each Profile Actually Counts
A Time Price Opportunity, or TPO, records that a price traded during a bracket. It doesn't mean price stayed there continuously throughout that bracket. Repeated visits within the same bracket don't add the same information as visits across successive brackets.
The Point of Control, or POC, is the price with the greatest count under the selected measurement. A TPO POC therefore describes repeated time-based participation, while a volume POC describes executed size.
Say traders spend a quiet morning rotating around a lower price zone. Later, aggressive buying produces a fast, heavily traded move higher. The volume POC can shift toward that burst while the TPO POC remains near the morning's longer-lasting balance.
Neither reading is automatically superior. They describe different aspects of participation, and disagreement can be more informative than apparent confirmation.
Keep the Measurement Consistent
Check whether your platform displays actual exchange volume or tick volume. Tick volume counts updates or price changes according to the feed's convention, rather than directly measuring executed contracts or shares.
Fix the session boundaries, bracket length, price grouping, value-area calculation, and treatment of overnight activity before making comparisons. Otherwise, a moving POC may tell you more about changed settings than changed behavior.
Reading Profile Shapes and Key Levels
Start with the landmarks before naming the pattern. The POC identifies the dominant price under your chosen measurement; Value Area High (VAH) and Value Area Low (VAL) mark the upper and lower boundaries of the calculated value area.
Those labels describe the distribution. They aren't automatic resistance, support, or entry signals. What matters is how current participants behave when price reaches them.
| Shape | What the profile looks like | Typical reading |
|---|---|---|
| Normal (bell) | A dominant central bulge with tapering tails | Balanced auction; test for rotation toward the POC |
| Double distribution | Separate activity clusters divided by a thin zone | Distinct accepted zones; test for quick travel through the gap |
| P-shape | Heavy activity near the top, thin below | Higher-price acceptance; short covering or late buying are possible explanations |
| b-shape | Heavy activity near the bottom, thin above | Lower-price acceptance; long liquidation or late selling are possible explanations |
| Thin or single print | Sparse bracket participation at a price | Rejection or fast traversal; watch what happens on a return |
Read the Shape as a Conditional Statement
A bell-shaped distribution supports a balance hypothesis because participants repeatedly transacted around a central region. Rotation toward the POC is a scenario to test, not a magnetic property of the level. Sustained activity outside the distribution would contradict a simple return-to-center plan.
A double distribution separates accepted regions with a thin bridge. Price previously traveled through that bridge without much time-based participation. If traders begin building a broad distribution there on a revisit, the earlier thin-zone interpretation needs updating.
P-shapes and b-shapes require particular restraint. A top-heavy profile shows higher-price acceptance, but the shape alone can't identify whether buyers opened new positions or short sellers closed existing ones. The corresponding caution applies to a bottom-heavy profile and presumed long liquidation.
Distinguish Observation from Explanation
A single print is a price represented by a lone bracket marker, not proof that nobody traded there. It records sparse time participation under your settings. A later return may produce rejection, renewed rapid movement, or entirely new acceptance.
Write what the chart establishes before writing why you think it happened.
Session length and event context also matter. An unfinished profile can resemble a pattern that disappears as trading continues, and a news-driven move can leave an extreme-looking distribution.
Mark the prior session's POC, VAH, and VAL first. Then record whether the new session rejects those references, pauses around them, or builds activity beyond them.
A Daily Market Profile Workflow
A useful routine separates preparation from interpretation. Keep the chart settings stable, mark the references before trading, and make the decision rule visible before the outcome is known.
This flowchart summarizes the preparation sequence.
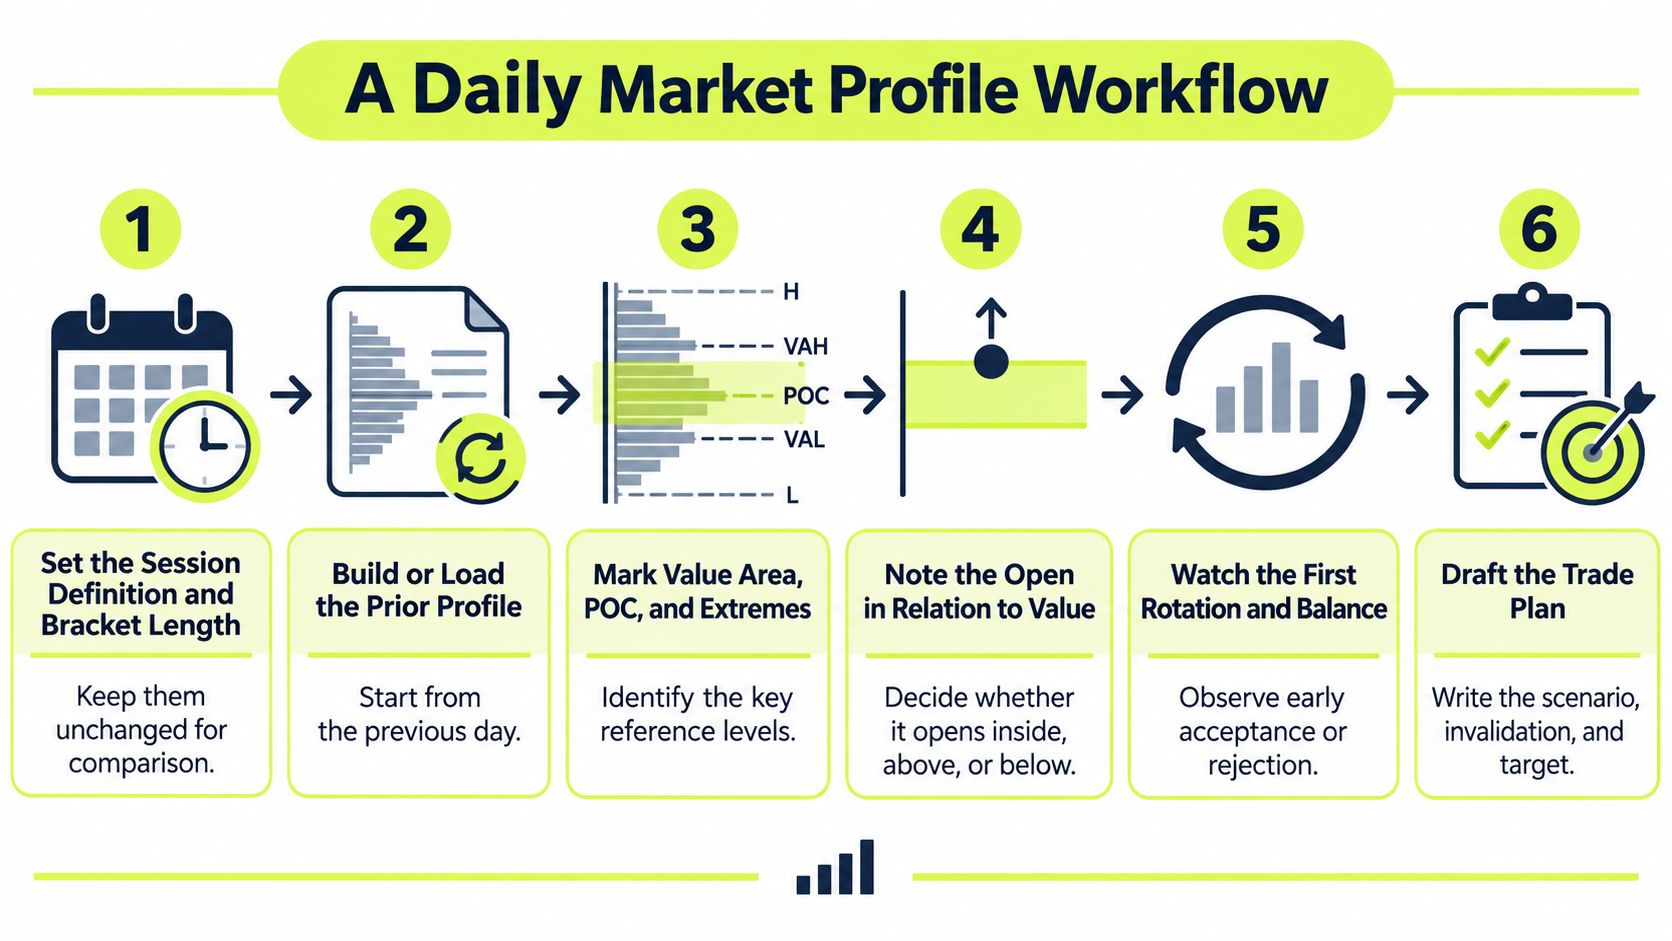
Build the Read Before Placing the Order
Set the measurement rules. Choose the session, bracket length, and overnight treatment, then save the layout. Changing them during a run of observations makes it difficult to distinguish a market change from a chart-setting change.
Load the completed prior profile. Mark its POC, VAH, VAL, and session extremes so you have references available before today's trading. Don't use the current session's eventual profile to explain an earlier entry.
Locate the open. Record whether price opens above, inside, or below prior value, and note the overnight range separately. An opening location gives context, but assuming it determines the day's direction skips the necessary observation.
Watch the early auction. Ask whether successive brackets build participation inside prior value or whether traders establish activity elsewhere. Don't call a brief touch acceptance, and don't call a quick move permanent rejection.
Write the hypothesis. For example, a failed attempt above prior VAH followed by renewed activity inside value could support a rotation toward the prior POC. Include the entry trigger, because a directional opinion without a trigger can justify almost any fill after the fact.
Define failure and review. Specify the price boundary that contradicts the trade, the protective exit, and when you'll reassess the developing profile. At the next bracket review, compare the observed behavior with the original statement rather than rewriting it.
Make the Journal Auditable
Your journal should preserve what you knew at decision time. Save the developing profile, not just the polished end-of-day version, and record any scheduled event that influenced the decision.
Use separate fields for the hypothesis, trigger, invalidation, target, observed shape, and outcome. Add a short explanation of whether the result came from the expected behavior, an unrelated price move, or an execution problem.
A winning trade can still have a poor explanation. If price reaches the target without the acceptance pattern you required, record the rule violation rather than treating the profit as validation.
Likewise, a properly executed losing trade doesn't automatically invalidate the whole method. The review should identify whether the scenario failed as expected, the rules were ambiguous, or you departed from them.
Worked Examples from Opening Location to Trade Plan
The following prices are hypothetical illustrations, not recommendations. Assume the prior session's value area runs from 5,410 to 5,430, with a POC at 5,420 and a session high at 5,445.
The diagram provides a visual reference for comparing opening locations.
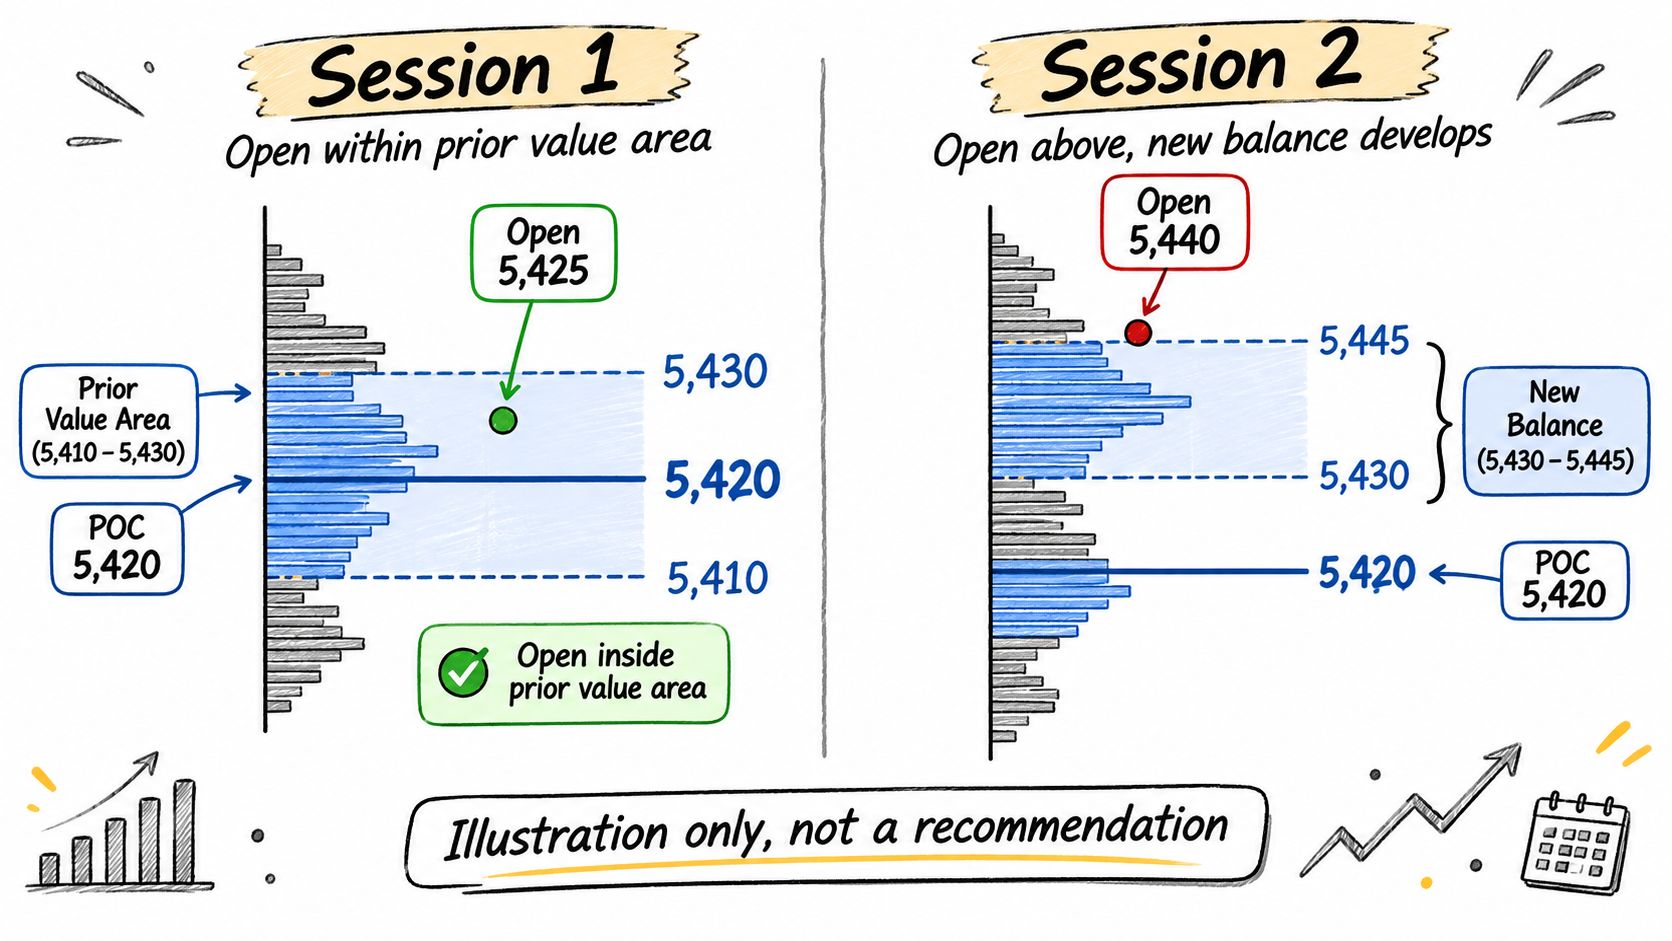
A Failed Attempt Above Value
Suppose the market opens at 5,450, then retreats toward prior value. The trader doesn't short merely because the opening price looks high. The hypothetical trigger is a return below 5,430, followed by a failed attempt to regain that boundary.
The written plan calls for a short toward 5,420, with a protective stop above the developing session's opening high. A separate contextual rule abandons the rejection thesis if traders rebuild acceptance above 5,445; the trader doesn't wait for that slower confirmation if the protective stop is reached first.
Later, price reaches the POC and builds TPOs around it. That supports the original rotation read, but it's not a fresh reason to enter the same trade. Once the target is reached, the original opportunity has changed.
This distinction prevents a common hindsight error: seeing the completed distribution and assuming the trader could have recognized it before entry. Use the guide to determining stop-loss and take-profit levels to separate structural invalidation from the amount of account risk you're willing to accept.
Acceptance Above the Old Range
In a different hypothetical session, price again opens at 5,450, holds above prior VAH, and rapidly traverses a thin region toward 5,470. Instead of chasing, the trader waits for a pullback and evidence that participants will transact above 5,450.
The continuation hypothesis is conditional: higher prices remain accepted, and the pullback doesn't rebuild value inside yesterday's range. If that condition fails, there's no continuation entry under this plan, even if the earlier upward move looked strong.
For an additional visual perspective on auction-profile interpretation, consider this video alongside your own written scenarios.
When the Rejection Trade Loses
Return to the short example. A news release produces aggressive buying, price regains the value high, and the protective exit is triggered.
The trade loses. Calling the move a temporary distortion doesn't justify keeping the position beyond its risk rule, and a later reversal wouldn't make that decision sound.
The transferable lesson isn't to favor reversal or continuation. It's to define which observable behavior authorizes the trade and which behavior ends it.
Testing Profile Setups Before Risking Capital
A convincing historical profile isn't evidence of a tradable edge. The DeltaMerge lesson on Volume Profile and auction-market theory supports using profile analysis as a hypothesis framework and cautions that evidence for persistent returns from profile landmarks alone is limited.
Costs can erase apparent profitability. The 2025 systematic review in Acta Informatica Pragensia identifies latency, scalability, and regulatory challenges in algorithmic trading, and notes retail traders' transaction-cost and technology disadvantages.
Specify What Would Count as Evidence
- Freeze the rule. Define entry, exit, invalidation, and acceptance criteria before examining results.
- Separate market conditions. Evaluate instruments, sessions, volatility conditions, opening locations, and event exposure rather than pooling everything.
- Reserve unseen observations. Keep out-of-sample data untouched while developing the rule.
- Charge realistic costs. Include commissions and plausible slippage, including less favorable conditions.
- Use a benchmark. Compare with an opening-range rule or moving-average filter.
- Set the sample requirement. Choose the minimum trade count and uncertainty assessment before testing, rather than stopping when results look attractive.
A high win rate can coexist with negative expectancy when losses are larger than gains or costs consume the difference. Don't treat a short profitable run as proof, and don't invent a universal sample-size threshold without considering outcome variability.
Testing standard: Keep a rule only when its evidence survives costs, unseen data, and a simpler alternative.
Use the strategy backtesting guide to formalize the experiment before risking capital. Pineflows is not investment advice, trading involves risk of loss, and a backtest is not a forecast.
Decide Whether Profile Analysis Fits Your Process
Profile analysis belongs in your process only if it contributes a distinct decision. If you already have a clear entry system, the profile might serve as a location filter rather than another source of buy and sell signals.
| Tool | What it adds | Overlap or conflict with profile |
|---|---|---|
| VWAP | Session average price weighted by volume | Another reference for traded value, but not the same calculation as POC |
| Opening range | Early-session high and low | Can duplicate boundaries already captured by the initial balance |
| Order flow | Real-time aggressive buying and selling | Helps assess current participation at profile levels, but requires additional data |
| Moving averages | Smoothed direction over selected periods | May respond later to abrupt changes; useful as a testing benchmark |
Give Each Tool a Job
A practical pairing uses profile for location, VWAP for a volume-weighted reference, and the opening range for early boundaries. Order-flow information can help evaluate the immediate response at a planned level, but it shouldn't become a discretionary excuse to override the invalidation.
Don't count agreement among related tools as independent evidence. A POC, VWAP, and moving average clustered around the same region may reflect overlapping historical transactions rather than separate confirmations.
Your implementation choice matters too. A discretionary observation such as strong acceptance must become an explicit rule before it can be automated reliably.
Choose the Appropriate Role
We support a test-first process at Pineflows: review incoming alerts in test mode before enabling live trading. Users must monitor their automations because alerts can arrive late, twice, or not at all, markets move, and brokers can reject orders.
Choose among these roles:
- Discretionary context. Use profiles to organize observations without claiming a mechanical edge.
- Testable rules. Translate a specific scenario into conditions that can be evaluated consistently.
- Controlled automation. Proceed only when the strategy evidence and delivery records justify it.
Measuring the Gap Between Signal and Fill
A chart can show the right trade while the account receives the wrong result. Your entry may arrive after price has moved, a broker may reject the order, or an incomplete fill may leave exposure different from what the strategy assumed.
Measure the delivery chain separately from the trading hypothesis. That separation lets you distinguish a failed market read from a correct read that couldn't be executed economically.
Build an Event-Level Record
Keep a record that connects each intended action to its observed outcome.
| Field | What to record | What it helps diagnose |
|---|---|---|
| Signal identity | Strategy version, instrument, action, event ID | Wrong configuration or duplicate processing |
| Alert timestamp | When the strategy emitted the event | Delayed delivery |
| Broker acceptance | Whether and when the broker accepted it | Rejections or connection failures |
| Fill details | Fill time, quantity, expected price, actual price | Slippage and partial execution |
| Missing events | Expected signals without matching receipts | Delivery gaps |
| Duplicate events | Repeated receipts for the same intended action | Repeated-alert frequency |
| Trading costs | Applicable fees and execution shortfall | Difference between simulated and realized results |
Use consistent timestamps and preserve the original payload. If the expected price comes from a completed historical bar but the alert arrives during a fast move, label that mismatch instead of treating the difference as unexplained slippage.
The guide to trade execution software provides a useful starting point for evaluating the handoff between a strategy and its broker orders. Focus on observable receipts and statuses, not just whether an interface says the automation is active.
Treat Live Verification as a Separate Gate
Test mode verifies that the intended event arrives with the expected contents. It doesn't establish a live fill price or demonstrate that the broker will accept every future order.
For our process, the first real fill serves as the execution test, and we show exactly what arrived. A manually sent TradingView test alert can leave placeholders blank, so it doesn't count as a real fill.
Review exceptions before expanding exposure. If an order's status is uncertain, reconcile it with the broker rather than assuming it failed and submitting another order.
The final decision should use the realized record: did the intended position arrive, at an acceptable cost, under the conditions the rule required? If not, improve or stop the implementation rather than adding another profile pattern.
Pineflows turns TradingView alerts from Pine Script strategies into Robinhood market orders for US equities and ETFs, with test mode, event visibility, and pause controls. Visit Pineflows to review a test-first execution workflow, then compare your written profile hypothesis with the alert and fill records before committing more capital.