November 12, 2026 · 12 min read · Pineflows team
What Is DCA: Dollar-Cost Averaging Explained for 2026
Dollar-cost averaging (DCA) means investing a fixed sum at regular intervals, such as weekly, monthly, or quarterly, rather than investing all available cash at once. A decade-long backtest of a monthly schedule produced a positive annualized return, while Vanguard's analysis across multiple markets found that lump-sum investing won most of the time. DCA can smooth the prices paid across purchases, but staging money that is already available may mean giving up expected return.
The key distinction is where the money comes from. When income arrives over time, investing each portion as it becomes available is a cash-flow decision. When a lump sum is already waiting in cash, investing it in stages is an allocation decision.
That difference changes what you are comparing. With ongoing income, the alternative may be leaving each new contribution uninvested until later. With a lump sum, the alternative is investing the full amount now. DCA is not one answer to both situations; it is a schedule whose trade-offs depend on what the uninvested cash would otherwise do.
Table of Contents
- What Dollar-Cost Averaging Means and Why It Exists
- How a Fixed Monthly Purchase Lowers Your Average Cost
- What Historical Research Says About DCA Versus Lump Sums
- Choosing DCA or Lump-Sum Investing for Your Situation
- Pros, Cons and the Costs That Change Real Results
- How to Set Up a DCA Rule Step by Step
- Confirm Your DCA Rule Before Committing Real Money
What Dollar-Cost Averaging Means and Why It Exists
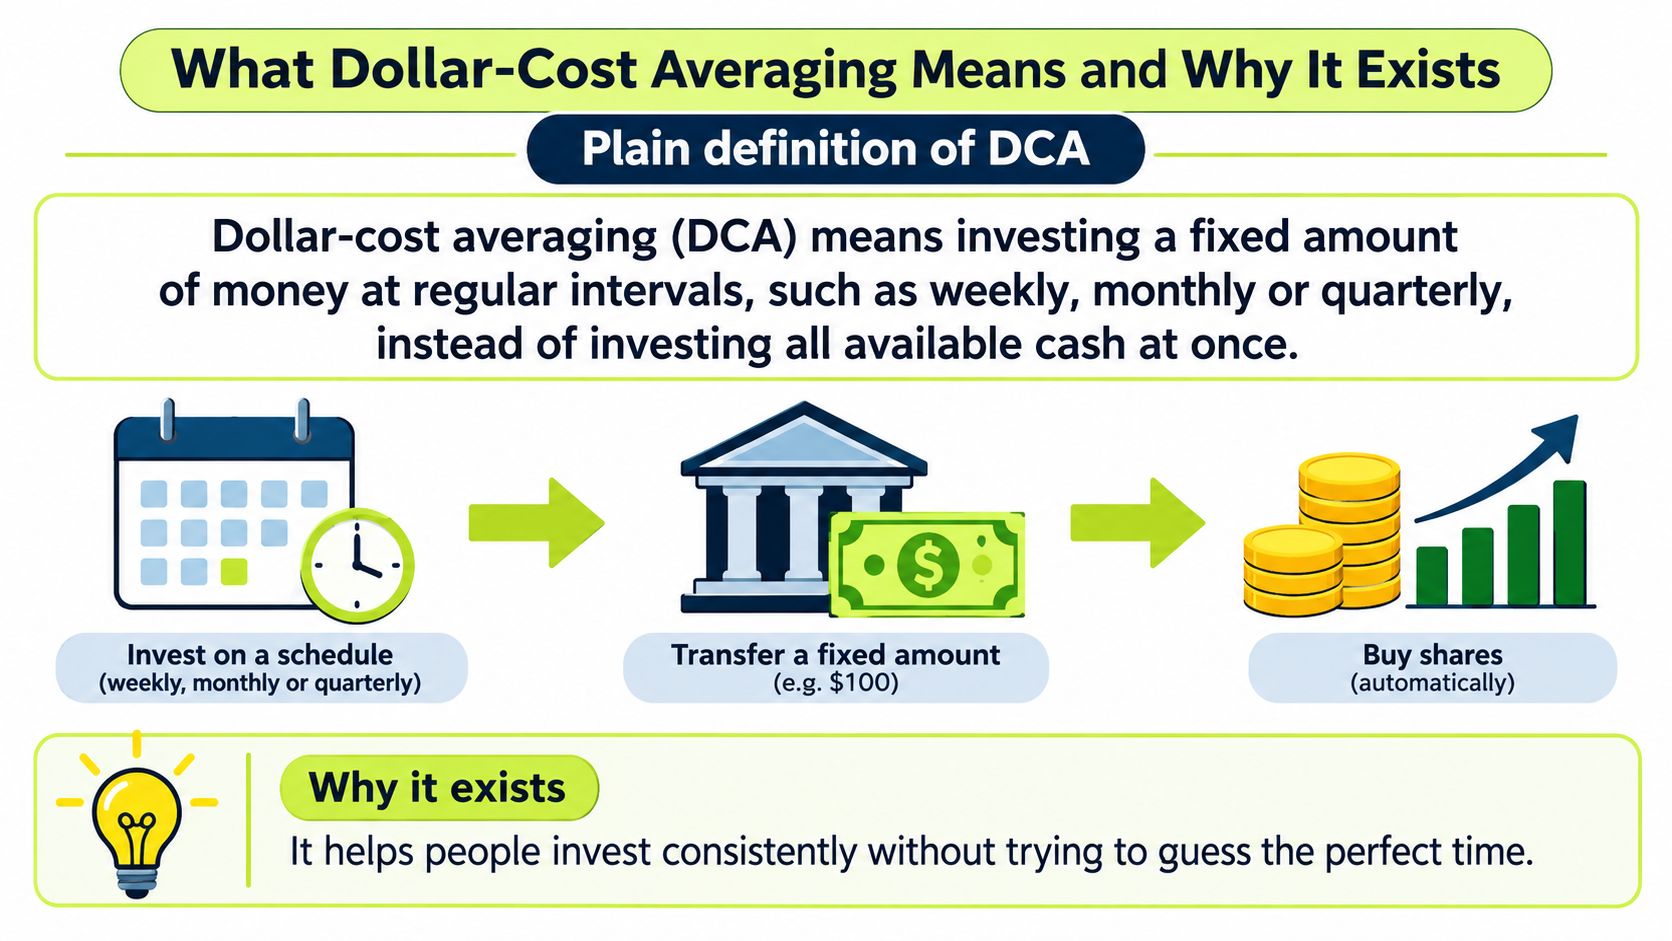
Dollar-cost averaging is a rules-based method. You commit a fixed dollar amount at predetermined intervals, and the number of shares you get moves inversely to price. A lower price buys more units, a higher price buys fewer. The SEC's investor guidance describes the approach as a way to reduce the risk of investing all your capital at an unfavorable time.
Dollar-cost averaging means investing a fixed amount of money at regular intervals instead of investing all available money at once.
Think of a standing grocery budget. You spend $200 on the same basket every month. When prices at the store dip, you carry home more food; when they climb, you carry home less. Nobody calls that a strategy in the aisle, but it's the exact mechanic behind DCA. Your budget is fixed, so the quantity flexes.
That smoothing is real, and it's modest. What DCA doesn't do is remove market risk. The fund can still fall and stay down for years, and a schedule keeps buying on the way. Nor is a scheduled purchase a verdict that an asset is cheap. It buys because the calendar says so, not because the price looks attractive.
Every workable DCA rule pins down six things before the first order goes out:
- Contribution size: the dollar amount per purchase, not a share count.
- Interval: weekly, monthly or quarterly, chosen once and kept.
- Asset: one fund or stock, confirmed against your actual goal.
- Execution timing: the day and time the order fires.
- Cash treatment: where unspent money sits, what it earns, and when it moves.
- Rebalancing limits: how far the position is allowed to drift before you intervene.
Answer one question before touching any of those. Is the money arriving over time from income, or is it already sitting in cash waiting for a decision? Your answer changes what the rest of this article means for you.
How a Fixed Monthly Purchase Lowers Your Average Cost
Numbers make the mechanism obvious. Say you put $200 into the same fund on the first of every month for six months, and the price wanders while you do it.
| Month | Share price | Shares bought with $200 | Running total of shares |
|---|---|---|---|
| January | $50 | 4.00 | 4.00 |
| February | $40 | 5.00 | 9.00 |
| March | $25 | 8.00 | 17.00 |
| April | $32 | 6.25 | 23.25 |
| May | $45 | 4.44 | 27.69 |
| June | $55 | 3.64 | 31.33 |
| Totals | Simple average $41.17 | 31.33 shares bought | $1,200 ÷ 31.33 = $38.30 average cost |
Walk the rows in order. January's $50 buys 4 shares. February's $40 buys 5. March is the month that does the heavy lifting: at $25, your $200 buys a full 8 shares, more than double January's haul. April adds 6.25 at $32, May adds 4.44 at $45, and June, the most expensive month at $55, adds only 3.64.
Six purchases, $1,200 invested, 31.33 shares owned. Divide the money by the shares and your average cost is $38.30.
Why the average lands below the simple average
Add the six prices and divide by six and you get $41.17. Your actual cost is $3.87 lower. The gap isn't luck. It's arithmetic: the cheapest month got the largest share count, so the average leans toward the low prices. Expensive months get a smaller vote because $200 buys less when the price is high.
Reverse the sequence and the effect weakens. If prices only climbed from January to June, your early purchases would have been the small ones, and a lump sum placed in January would have beaten the schedule. Averaging helps most when prices fall and recover within your buying window. It helps least in a steady climb.
A real-world check on the habit: a 2024 analysis of 10 years of SPY data found that a monthly dollar-cost-averaging strategy produced a 7.67% annualized compounded return, according to the POEMS comparison of DCA and market timing. That's one backtest of one fund with no lump-sum comparison in the same study, so read it as evidence that the schedule held up over a decade, not as proof that DCA beats investing at once.
The formula travels with you: average cost equals total amount invested divided by total shares bought. Run it on your own plan and you'll know more than any headline number tells you.
What Historical Research Says About DCA Versus Lump Sums
Suppose you have a lump sum ready to invest, but plan to spread it across several months. During that wait, some of the money stays out of the market. That trade-off helps explain why Vanguard's study of investing now versus temporarily holding cash found that investing the full amount at once outperformed cost averaging roughly two-thirds of the time.
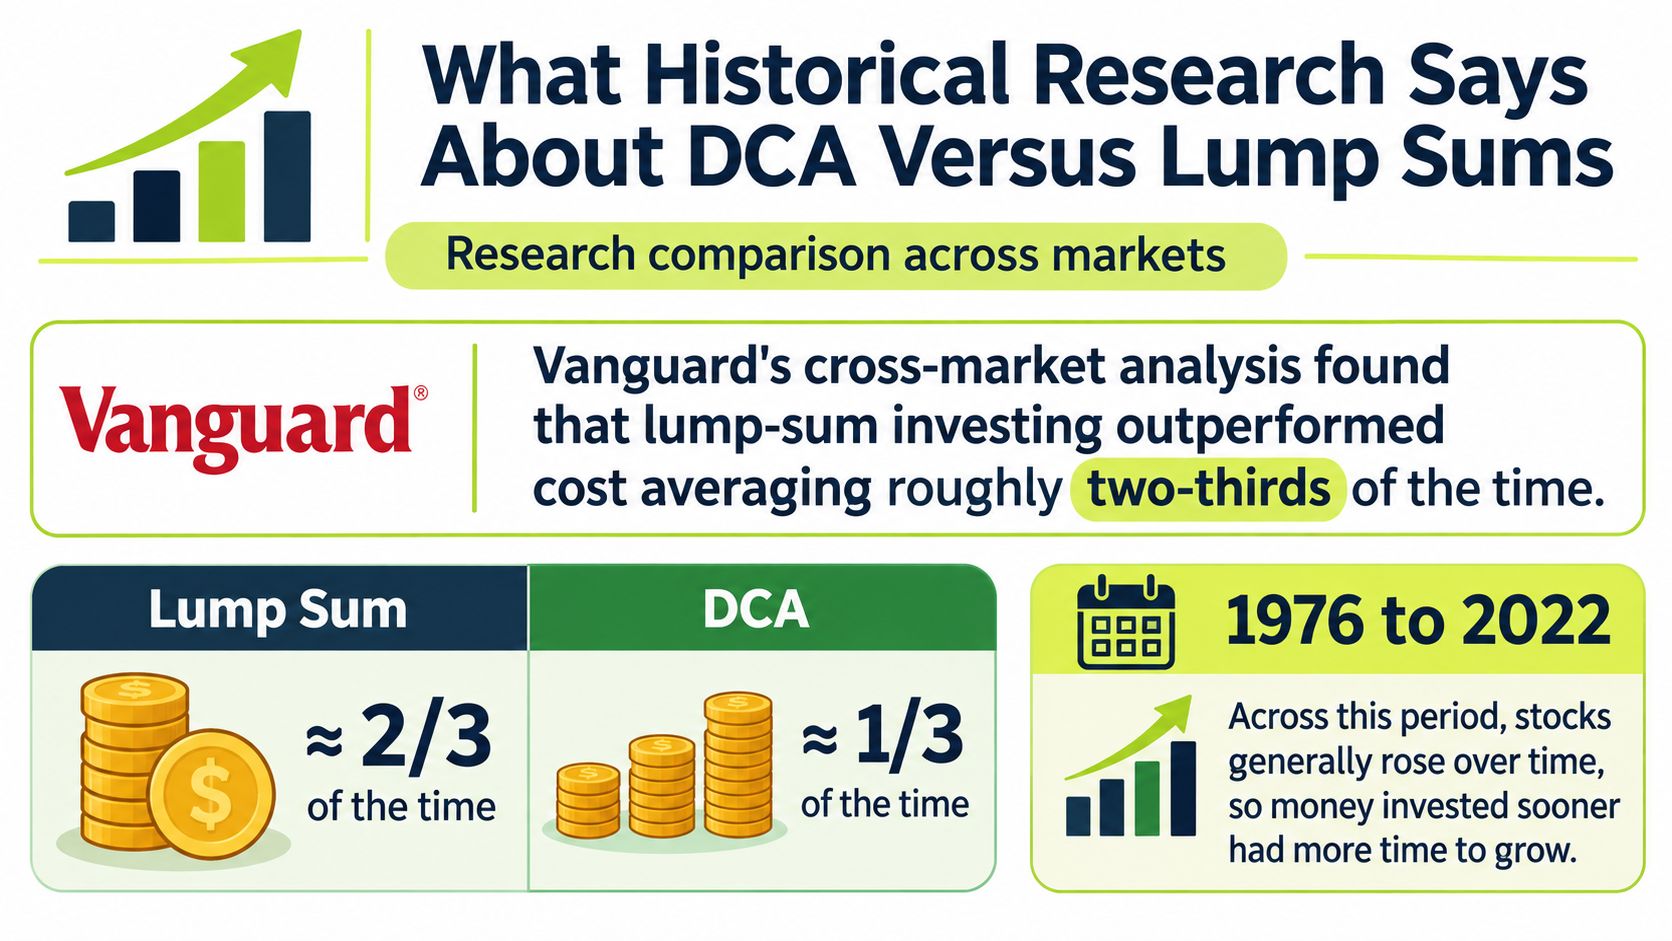
The reason is straightforward: cash waiting for its turn is not invested. When the market rises during the waiting period, a lump sum participates in those gains sooner. When prices fall, however, later scheduled purchases may buy at lower prices, and spreading the investment can feel easier to stick with.
The result is a probability, not a promise. DCA may suit someone who would otherwise leave the money in cash because of fear. A schedule can also soften the regret of investing just before a drop, though it cannot prevent losses.
A strategy that wins most of the time still loses some of the time. The practical question is what your uninvested cash would otherwise be doing, and whether the potential cost of waiting is acceptable to you.
For a fair historical comparison, hold the final allocation, contribution schedule, cash yield, fees, taxes, and execution assumptions constant. Look beyond terminal wealth and annualized return: maximum drawdown, volatility, downside deviation, time to invest, and the range of outcomes across rolling periods can show what the average hides. A guide to backtesting a trading strategy explains how assumptions shape a comparison.
Judge a schedule by both its expected return and the experience you can stick with.
Choosing DCA or Lump-Sum Investing for Your Situation
The deciding question is narrower than it looks. Is there idle money to deploy, or is new income arriving over time? FINRA notes that spreading investments over time can reduce the effect of short-term market swings, yet usually produces lower returns than investing a lump sum, because part of the money stays uninvested, as FINRA's explainer on dollar-cost averaging sets out.
A comparative analysis of 1,099 rolling seven-year periods found that lump-sum investing outperformed a three-month-or-longer DCA schedule in more than 56% of periods, while DCA produced modestly lower volatility, per the same FINRA source.
That's a thinner edge than the two-thirds figure, and the difference matters. Shorter windows and different markets tilt the result. Neither number tells you what your next seven years will do.
| Situation | Usually better fit | Why |
|---|---|---|
| Windfall, long horizon, comfortable with drops | Lump sum | Historical data favors being fully invested sooner |
| Windfall, fear of investing before a drop | DCA over three months or longer | Behavioral benefit may justify the lower expected return |
| Paycheck contributions every month | Periodic investing (DCA) | No idle lump sum exists; money arrives over time |
| Money needed within 2 years | Lower-volatility, cash-like holdings | A drawdown may not recover before the money is needed |
For a windfall, DCA is a compromise between timing risk and loss aversion, and it's worth naming it that way out loud. You're buying a smaller chance of a terrible entry price with a smaller expected return. For paycheck investing, there's no compromise at all: the cash arrives in installments, and buying as it lands is the plainest possible process.
Three questions settle most cases. What would the cash do otherwise? A savings account earning very little is a weak alternative to being invested. Over what horizon? Ten years gives a drawdown time to heal; eighteen months doesn't. What drawdown can you sit through without selling? If the honest answer is 15%, your allocation is the problem, not your purchase schedule.
Pros, Cons and the Costs That Change Real Results
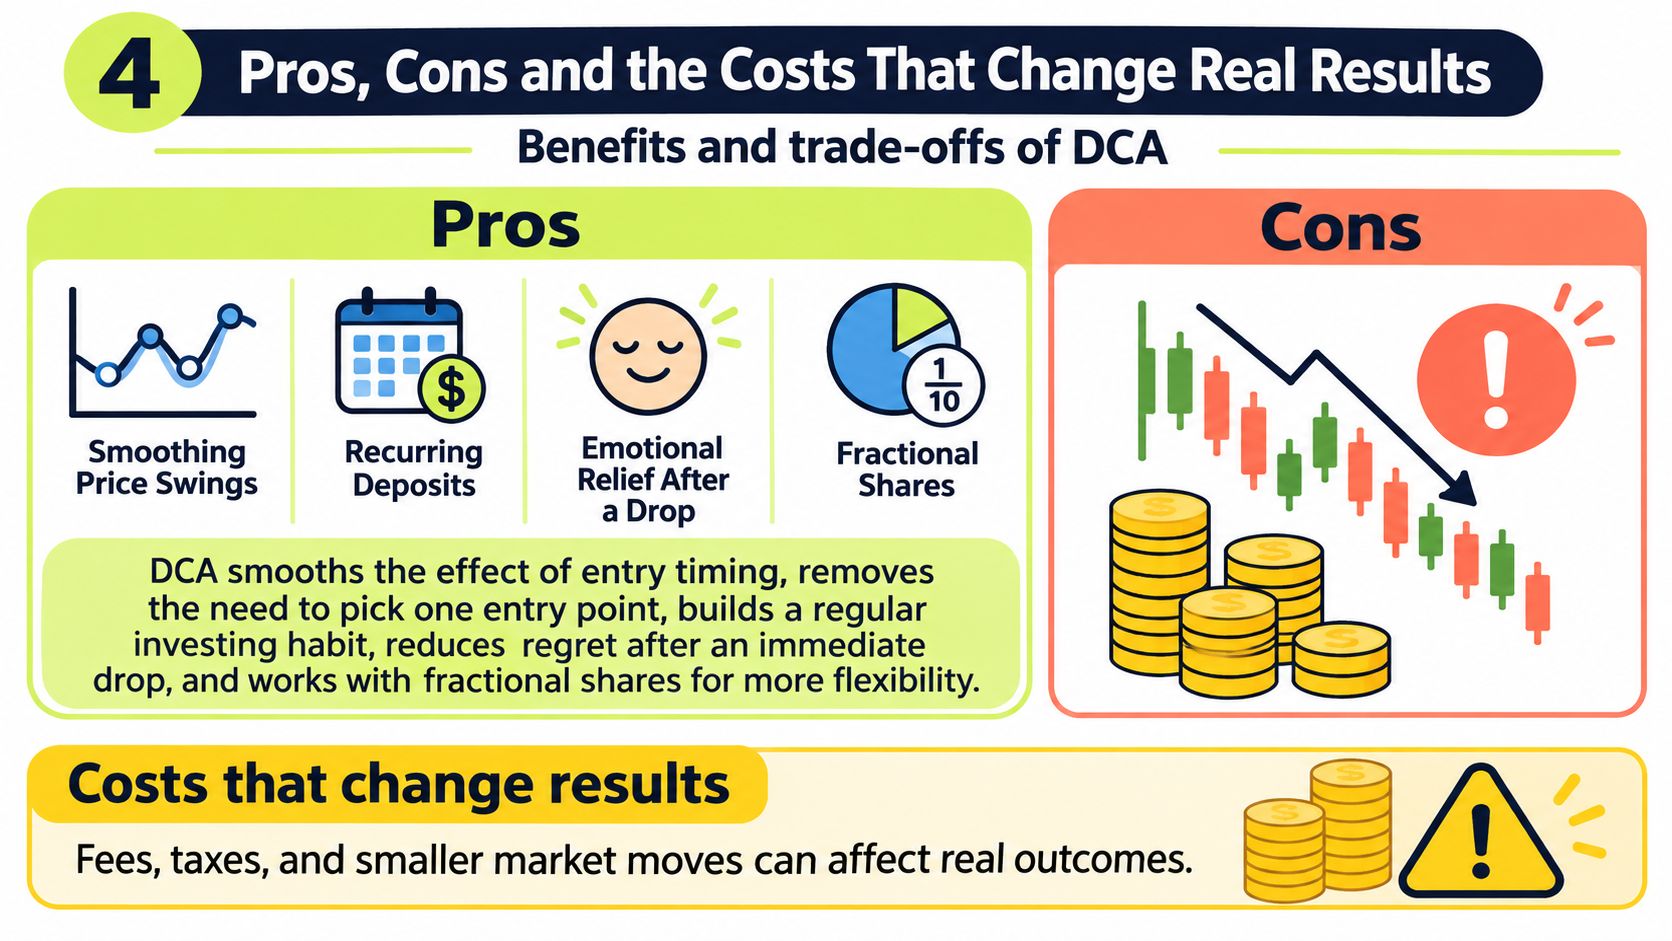
The case for DCA rests on five practical benefits, and none of them are about beating the market:
- Smoother entry: you buy more units after a fall and fewer after a rise, so no single purchase sets your cost.
- One fewer decision: the entry point stops being a judgment call you can get wrong.
- Built-in habit: a recurring transfer turns investing into something that happens without willpower.
- Regret control: after an immediate drop, the next purchase is already scheduled, which makes staying invested easier.
- Fractional shares: small contributions can go to work in higher-priced funds and stocks instead of waiting for a round lot.
The drawbacks are just as concrete. A fixed schedule keeps buying through a prolonged decline, and it can't stop the losses, only spread them out. A steady drip of purchases can also make a weak asset feel like a bargain, because each lower price looks like a discount rather than a warning. And uninvested cash does dilute expected return.
Then come the costs that never appear in a gross average:
- Per-order fees: a $5 commission on a $100 purchase is a 5% haircut before the market does anything.
- Bid-ask spread: small orders in thin instruments cross the spread more often, and that gap is a real cost per purchase.
- Tax treatment: every lot can be a separate taxable event, and frequent sales make the record harder to reconstruct.
- Fractional-share residue: if your platform only allows whole shares, leftover cash accumulates and earns nothing.
- Idle cash yield: money parked between installments may earn far less than the asset you're gradually buying.
Check before you commit: multiply your contribution by your fee, divide by the contribution, and look at the percentage. If costs eat more than a fraction of a percent per purchase, shorten the schedule or switch to a commission-free route.
The order-routing side deserves the same scrutiny as the schedule itself, because that's where fills and fees really get decided. This walkthrough of connecting alerts to Robinhood orders shows what happens between a signal and a fill.
DCA is a purchase schedule, not an argument that something is undervalued. Judge yours on what lands in your account after fees, spreads and taxes, not on a gross average that ignores all three.
How to Set Up a DCA Rule Step by Step
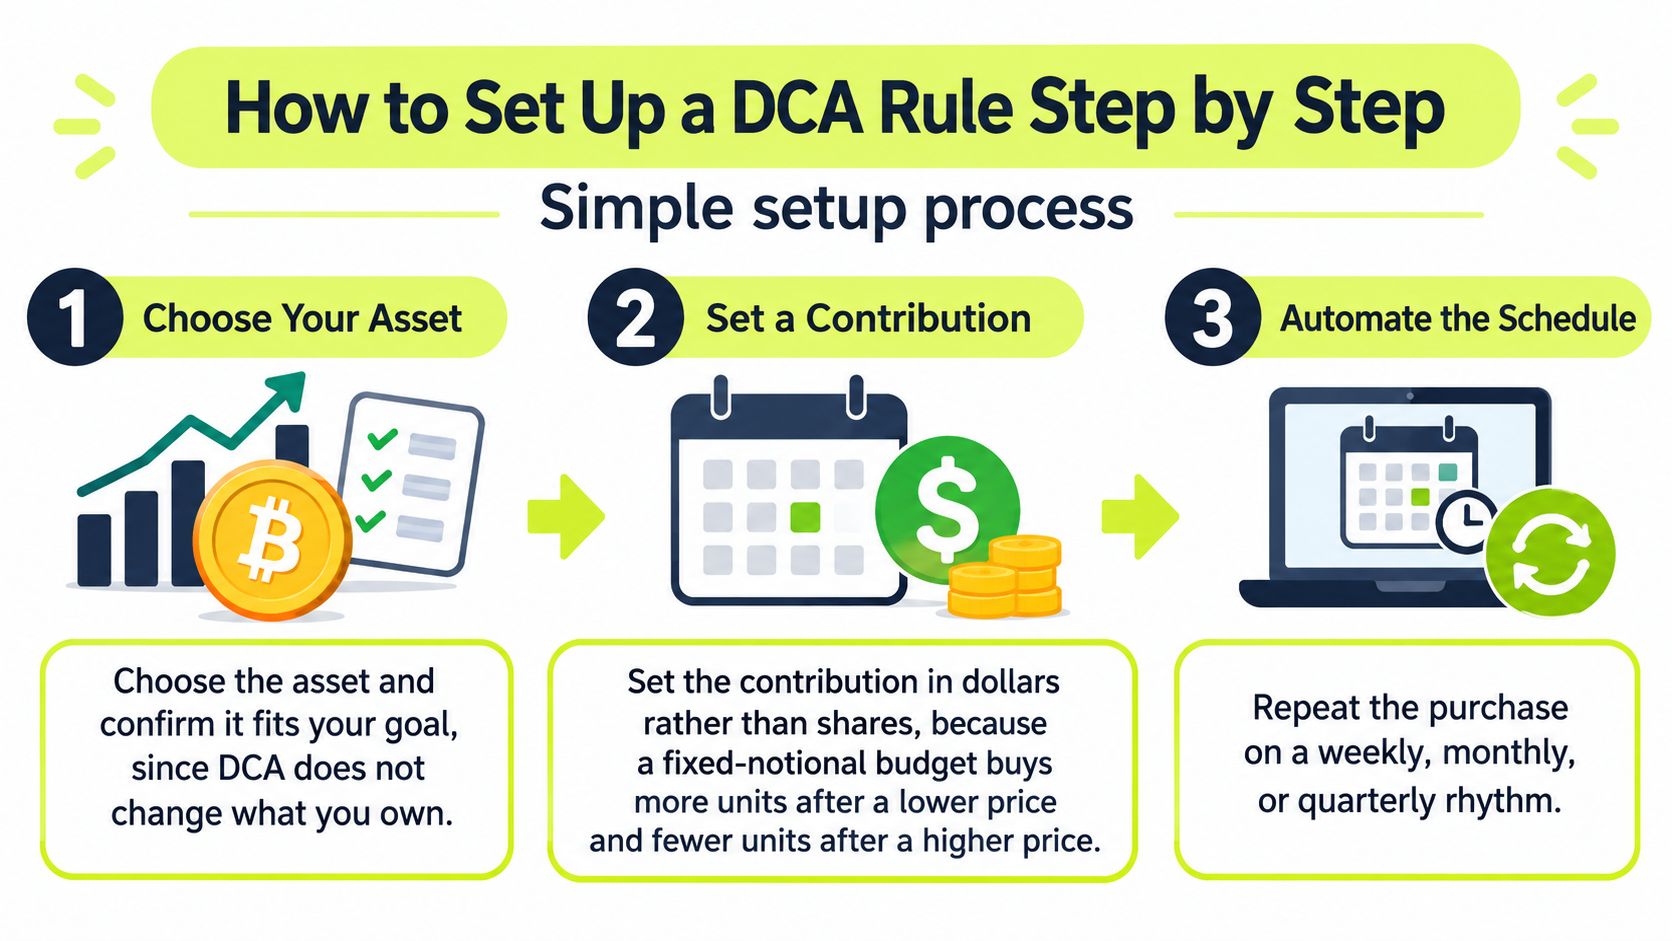
1. Choose the asset and confirm it fits your goal. The schedule changes when you buy, never what you own. A mediocre fund bought patiently is still a mediocre fund, so settle the holding first, then the mechanics.
2. Set the contribution in dollars, not shares. A fixed dollar budget buys more units after a decline and fewer after a rise. A fixed share count does the opposite: it demands more cash exactly when prices are high. That difference compounds over years, and it's the most common setup mistake.
3. Pick the interval and hold it. Weekly, monthly or quarterly all work. What doesn't work is changing the interval after every headline, because that turns a rule into a reaction.
4. Write down the cash treatment. State where unspent money sits, what it earns, and the date it gets deployed. Skipping this step is how a plan slowly turns into a savings account with extra paperwork.
5. Fix execution timing and rebalancing limits. Choose the day and time an order fires, and decide how far the position may drift before you trim it. Without a limit, a long-running schedule slowly becomes an accidental concentration.
6. Add duplicate protection if alerts drive the orders. Use a unique event ID per alert so one signal can place at most one order. A repeated or re-delivered alert without that guard doubles your position, and you find out after the fill.
7. Install a global pause that blocks new entries. Keep valid exits available so risk handling still works while entries are frozen. The pause is your circuit breaker for a broken webhook, a bad config or a market you no longer want to buy.
8. Run it in test mode first, then read the log. Send the schedule with live orders disabled, and review one full interval of output before any capital moves. Logs show you timing, duplicate handling and sizing in a way a backtest can't. A setup built for this, like Pineflows, ships test mode as the default, an event ID per alert, and a pause control that leaves exits open, so the review step is a matter of reading rather than rebuilding. Tools for automated investing usually expose the same controls in their scheduling screens.
Confirm Your DCA Rule Before Committing Real Money
The last pass is a checklist, not a leap of faith. Run through it once, slowly, and most avoidable mistakes surface before they cost anything.
- Match the contribution to the source. A monthly amount should come from your paycheck rhythm. A windfall schedule should divide a known lump, not an imagined one.
- Confirm what the cash earns and what each trade costs. Cash yield, fees and tax treatment each change your net result, and a plan built on gross numbers can look fine while losing money.
- Set a drawdown level that triggers a review, not a sale. Decide the number in advance, when you're calm, so a bad month produces a checklist instead of a panic.
- Check the horizon against the holding. Money you need within two years doesn't belong in something that can fall hard and stay down.
- Prove the duplicate guard and the pause. Send the same alert twice and confirm only one order results, then hit pause and confirm new entries stop while exits still work.
- Read a full interval of test-run logs. One complete cycle shows you timings, sizing and delivery confirmations before real money moves.
Practical rule: if you can't state your plan in one sentence, it isn't a rule yet. Write the sentence first and the automation second.
Write that sentence now: dollar amount, interval, asset, and where the cash waits in between. Something like "I invest $250 in the same index fund on the 5th of each month, and unspent cash stays in the money market fund until the order fires."
Test it, read the log, then fund it.
Pineflows turns Pine Script alerts from your TradingView strategies into executable Robinhood orders, with a test-first pipeline that logs each alert before any order is sent. Every alert carries its own event ID so a repeated signal can't double your position, and a single pause control blocks new entries while keeping valid exits available. If you're building a scheduled or alert-driven purchase rule, visit Pineflows to see how the test mode, duplicate detection and event log work in practice.