November 7, 2026 · 12 min read · Pineflows team
How Many Trades Per Day Is Right for Your Strategy

The popular advice to aim for a fixed number of trades each day gets the decision backward. You don't need enough trades to feel productive. You need a strategy whose additional trades still justify their costs, capital requirements, and execution risk.
The useful answer to how many trades per day is a ceiling, not a quota. Derive that ceiling from your backtest, reduce it when account or execution constraints require, and accept sessions when your rules produce no entries.
Table of Contents
- Typical Trade Counts by Strategy Style
- When Extra Trades Stop Paying
- Derive Your Daily Target From Backtest Results
- Rules That Cap How Often US Accounts Can Trade
- Pick a Daily Ceiling With a Worked Example
- Set Your Daily Trade Limit Before Going Live
Typical Trade Counts by Strategy Style
A strategy label cannot set a daily trade target. Entry rules, holding periods, and available capital determine how often valid opportunities arise. The table compares those mechanics, not numerical quotas.
| Strategy style | Typical trades per day | Typical holding time | Main limit on frequency |
|---|---|---|---|
| Long-term investing or buy and hold | No daily quota, transact when allocation rules require | Months to years | Tax efficiency and holding cost |
| Swing trading | Entries only when a multi-session setup qualifies | Days to weeks | Overnight risk and gap fills |
| Intraday trend or breakout | Entries when distinct session setups qualify | Minutes to hours | Commissions, spreads, and attention |
| Scalping | Repeated entries while executable short-term signals persist | Seconds to minutes | Spread, slippage, and latency |
| Market making or high frequency | Quote- and event-driven, constrained by system throughput | Very short, potentially milliseconds | Infrastructure and exchange access |
For a buy-and-hold investor, dividing transactions by trading days adds little value. Allocation changes drive activity; adding trades to meet a quota would change the strategy.
Swing traders may hold positions across sessions, so open exposure can limit new entries more than that day's trade count. Overnight gaps also mean a planned exit price is not guaranteed.
Intraday trend and breakout systems must distinguish a new opportunity from another alert generated by the same setup. When configuring a trend-follower strategy, specify whether re-entry is allowed after an exit and whether a persistent condition can trigger repeated orders.
Define what you're counting
A hypothetical breakout script may send several alerts during a normal morning. Those alerts do not necessarily represent separate completed trades.
- Alerts are messages emitted by TradingView.
- Orders are instructions submitted to the broker.
- Fills record executed quantities, potentially across partial executions.
- Round trips pair an opening transaction with the closing transaction.
Choose the unit before comparing results. Accepted entries are often more useful for daily strategy controls than raw alerts. Retain the full sequence for reconciliation.
For scalping, the distinction matters because small intended price moves leave little room for execution costs. Market-making strategies face a different constraint: quote management and infrastructure beyond a simple alert-to-market-order workflow.
Market size isn't your frequency benchmark
The Bank for International Settlements' 2025 survey commentary reports approximately $9.6 trillion in average daily OTC foreign-exchange turnover in April 2025, covering FX instruments on a net-net basis. That figure measures aggregate notional activity, not the number of executable opportunities in your script.
Practical rule: If your entry log looks busier than your strategy description suggests, inspect signal persistence, re-entry rules, and position-state handling before live deployment.
When Extra Trades Stop Paying
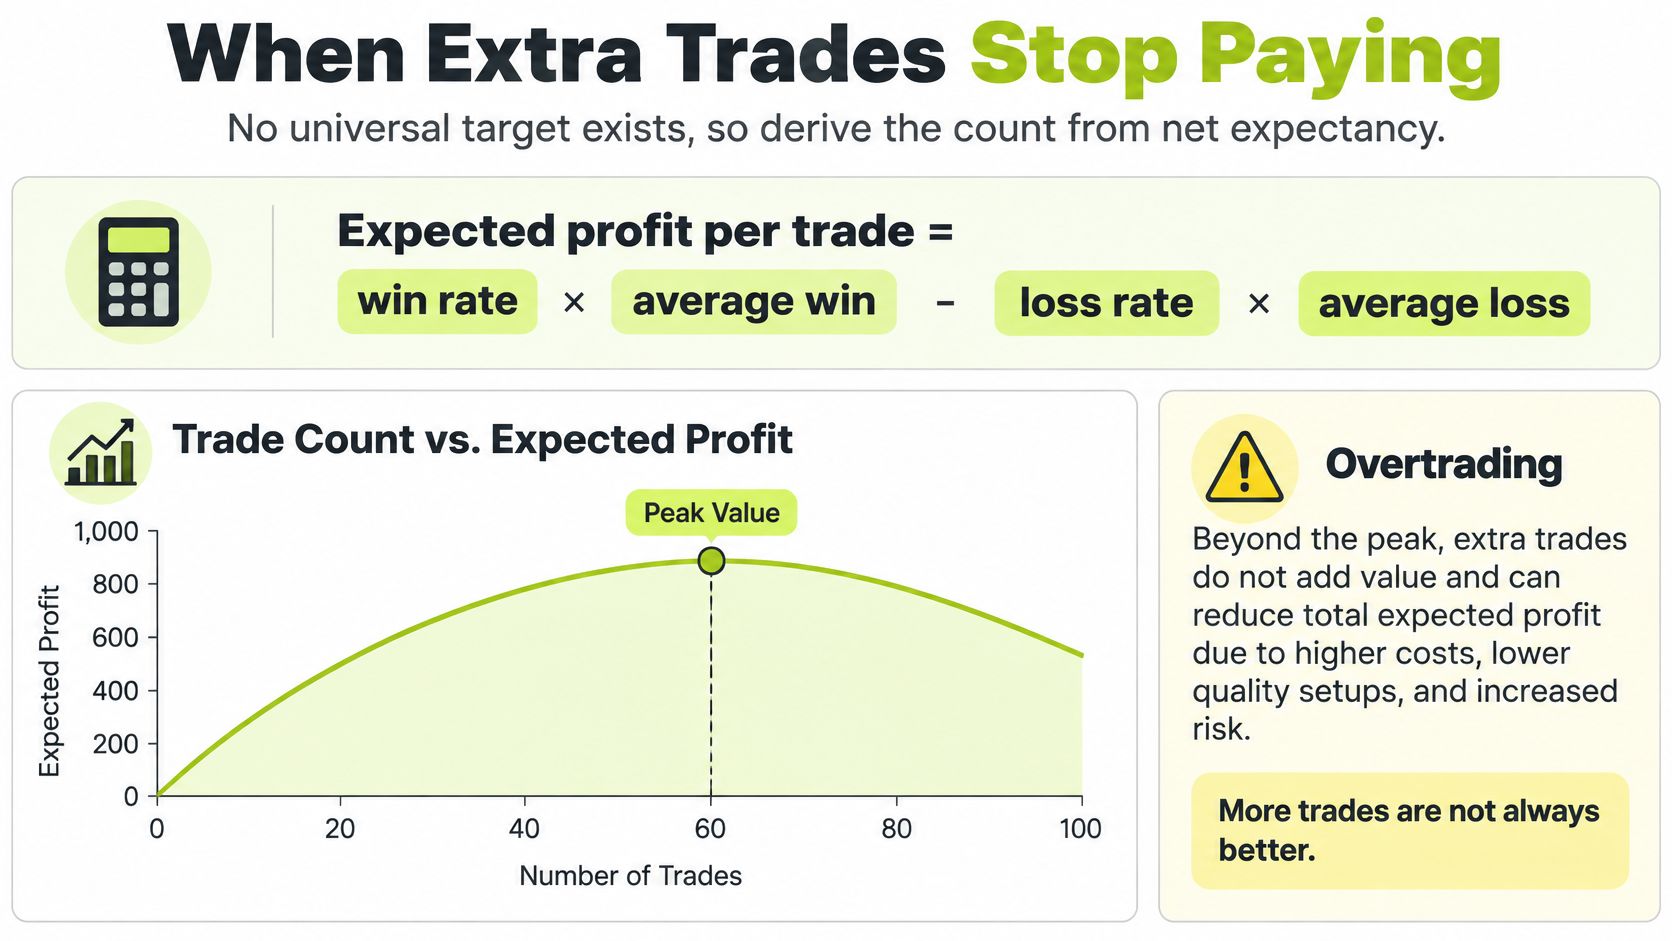
No universal target exists because an extra trade helps only when its marginal net expectancy is positive. Start with the expected outcome of the trade, not the number of opportunities your script can generate.
Expected profit per trade = win rate × average win − loss rate × average loss − round-trip costs
Use consistent units throughout. If average wins and losses are returns on position notional, express spread, commissions, and slippage on the same basis.
The chart illustrates the decision concept, not a measured profit curve for a particular strategy.
Separate cost arithmetic from a return forecast
For a hypothetical calculation, assume a gross edge of 0.15% per round trip and all-in round-trip costs of 0.10%. Subtraction leaves 0.05% net expectancy before considering estimation error.
Doubling activity doubles modeled costs. It also doubles modeled expected profit only if the additional trades retain the same edge, sizing, and execution quality. If weaker setups account for the extra activity, that assumption fails.
The following table is a hypothetical arithmetic illustration, not an observed trading statistic. It assumes 250 trading days, 0.10% cost per completed trade, and position notional equal to a fixed starting-capital reference on every trade.
| Trades per day | Cost drag per year |
|---|---|
| 1 | About 25% of capital |
| 3 | About 75% of capital |
| 5 | About 125% of capital |
| 20 | About 500% of capital |
These are summed expenses relative to reference capital, not compounded losses or forecasts. Repeatedly reusing capital can generate cumulative transaction expenses exceeding that reference amount.
The affordable count ends where the next qualifying trade no longer has a credible positive expectancy after costs. A cushion matters because backtested execution assumptions aren't guaranteed live.
Execution can invalidate the calculation
Zero commission doesn't mean zero cost. Spreads, slippage, delayed signals, rejected orders, and partial fills can change the outcome. Correlated positions can also turn apparently separate trades into concentrated exposure.
The BIS commentary on its earlier FX survey measured average daily OTC FX turnover of $7.5 trillion in April 2022. Even that substantial market-wide activity says nothing about your alert pipeline's capacity or your achievable fills.
Track valid signals, filled and rejected orders, holding time, realized execution costs, and maximum simultaneous exposure. Don't use raw alert count as a substitute.
The FINRA intraday-margin proposal reports 32,801,857 accounts with no qualifying day trades in its CAT analysis and records September 2025 approval of proposed amendments to replace the pattern-day-trading framework with an intraday-margin approach. The distribution isn't evidence that low frequency causes better returns, and approval of proposed amendments isn't proof that replacement rules are already operative.
For an additional perspective on trading activity, watch the accompanying video.
At Pineflows, we execute your strategy, not make it profitable, and we don't display projected returns. Every alert carries an event ID, so the same alert never trades twice, but users must still monitor delivery and broker outcomes.
A well-selected opportunity can be preferable to a batch of negative-expectancy entries. Automation makes activity easier to execute, not easier to justify.
Derive Your Daily Target From Backtest Results
A defensible ceiling starts with an export of actual strategy events. Use TradingView's trade records alongside your signal logic, and resolve discrepancies before calculating a daily average.
The objective isn't to reproduce the busiest historical session. It's to distinguish expected activity from bursts that deserve investigation.
Build an entry distribution
Export accepted entries. Separate opening transactions from exits, replacements, and scale-in instructions. Decide explicitly whether adding to a position consumes another entry allowance.
Group by trading session. Use the instrument's session calendar and a consistent timezone. Include sessions with no entries, otherwise you'll overstate ordinary frequency.
Calculate the average and inspect the distribution. The mean describes activity across the sample. It doesn't show whether entries cluster on a small group of busy days.
Choose a candidate upper boundary. Select a high percentile of daily entries as an initial investigation threshold, not an automatically optimal trading rule. Examine the sessions above it to determine whether they contain valid opportunities or repeated signals.
Replay the strategy with the ceiling enabled. Blocking entries can alter later positions, exits, and available capital. Recalculate performance rather than deleting excess trades from a spreadsheet and assuming everything else stays unchanged.
Check clustered activity. Inspect the busiest session and consecutive busy sessions. Daily averages can hide both correlated exposure and rolling account-rule constraints.
A structured trading-strategy backtest should preserve enough detail to reproduce those decisions. Record the rule version, session definition, treatment of additional entries, and the reason each blocked signal was excluded.
A historical percentile describes what happened. It doesn't prove that trades above it are unprofitable.
Validate the capped strategy
Compare capped and uncapped versions for net results, drawdown, exposure, and execution assumptions. If the ceiling removes your strongest opportunities, a better signal filter may be more appropriate than a blunt daily cutoff.
Forward observations then test whether the historical distribution remains useful. Repeat the calculation after changes to instruments, sessions, filters, or re-entry logic, even when the headline win rate barely changes.
Rules That Cap How Often US Accounts Can Trade
US trading constraints come from account type, buying power, settlement, and applicable broker rules, not a universal daily allowance. A strategy can pass its expectancy test and still be unsuitable for the account intended to execute it.
The SEC day-trading bulletin describes the traditional pattern-day-trader test as four or more day trades within five business days, when those day trades exceed 6% of total trades during that period. This is a rolling classification test for the relevant margin-account activity, not permission to make a fixed number every day.
A rolling window defeats daily averages
Consider a hypothetical week with round trips clustered early in the week and additional round trips before the week ends. An apparently modest average can still cross a rolling threshold.
Log entry and exit timestamps, instrument, quantity, and broker execution status. Don't assume TradingView's completed-trade total exactly matches the broker's regulatory counting method, particularly when positions involve partial exits or additional entries.
The ACII comment on FINRA's day-trading review%20Comment%20on%20Regulatory%20Notice%2024-13_2.28.2025.pdf) describes the existing framework's $25,000 minimum-equity requirement for pattern day traders. That document is a comment on the rules, not a substitute for your broker's current account disclosures.
Separate regulatory and operational permissions
A cash account doesn't provide unlimited turnover. Track settled funds and confirm which proceeds are available for a new purchase under the broker's settlement and payment rules. In a margin account, inspect applicable day-trading buying power and restrictions separately.
For our Robinhood stock-trading workflow, keep these requirements distinct:
- Funding: Maintain sufficient buying power for each intended entry.
- Connectivity: Keep a valid Robinhood connection and a TradingView plan that can send webhooks.
- Execution scope: We place market orders only, for US equities and ETFs.
- Direction: We execute long only. Short signals flatten an existing position instead of opening a short.
Check the rule currently in force before deployment. Reform proposals and approval milestones don't establish what your broker applies to your account today. Save that confirmation with the strategy configuration, then use the most restrictive applicable boundary when setting the ceiling.
Pick a Daily Ceiling With a Worked Example
Consider a hypothetical comparison between a scalper and a breakout system. Both produce mechanically valid signals, but only a strategy with credible positive net expectancy should proceed to a live-frequency decision.
The scalper fails before frequency matters
Suppose the scalper has a small gross advantage that disappears once realistic spread and slippage estimates are included. Its backtest may show frequent wins, yet its expected result after execution expenses is negative.
Its appropriate live ceiling is no entries until the economics improve. Reducing activity helps only if the filter removes disproportionately poor trades. Merely trading the same negative-expectancy setup less often reduces expected losses without creating an edge.
Increasing position size is worse. It magnifies the same unfavorable economics while consuming more buying power.
The breakout system earns a conditional ceiling
Now suppose the breakout system retains a positive edge after conservative execution assumptions. Its entry distribution shows ordinary sessions with limited activity and occasional bursts.
The analyst should test a ceiling around the upper end of ordinary activity, then rerun the strategy with that ceiling enforced. If the blocked entries mostly reflect repeated breakouts in choppy conditions, the cap may improve the tested outcome. If they contain the strongest trend opportunities, use a setup-quality or exposure rule instead.
| Decision test | Scalper | Breakout system |
|---|---|---|
| Net edge after realistic costs | Negative | Positive under stated assumptions |
| Live-frequency decision | Keep disabled | Test a candidate ceiling |
| Account permission | Doesn't rescue the strategy | Can require a lower ceiling |
| Execution readiness | Insufficient reason to proceed | Must still be demonstrated |
The breakout strategy's statistical ceiling is only conditional permission. Settled cash, buying power, rolling day-trade restrictions, and existing exposure can require the automation to accept fewer entries.
A ceiling isn't a promise to trade. It limits activity when valid opportunities exist; it doesn't create opportunities when they don't.
Write the final rule as a conjunction: accept an entry only when the signal qualifies, the daily allowance remains available, the account permits it, and exposure remains within plan. A strategy that passes only the historical-profit test isn't ready for automatic execution.
Set Your Daily Trade Limit Before Going Live
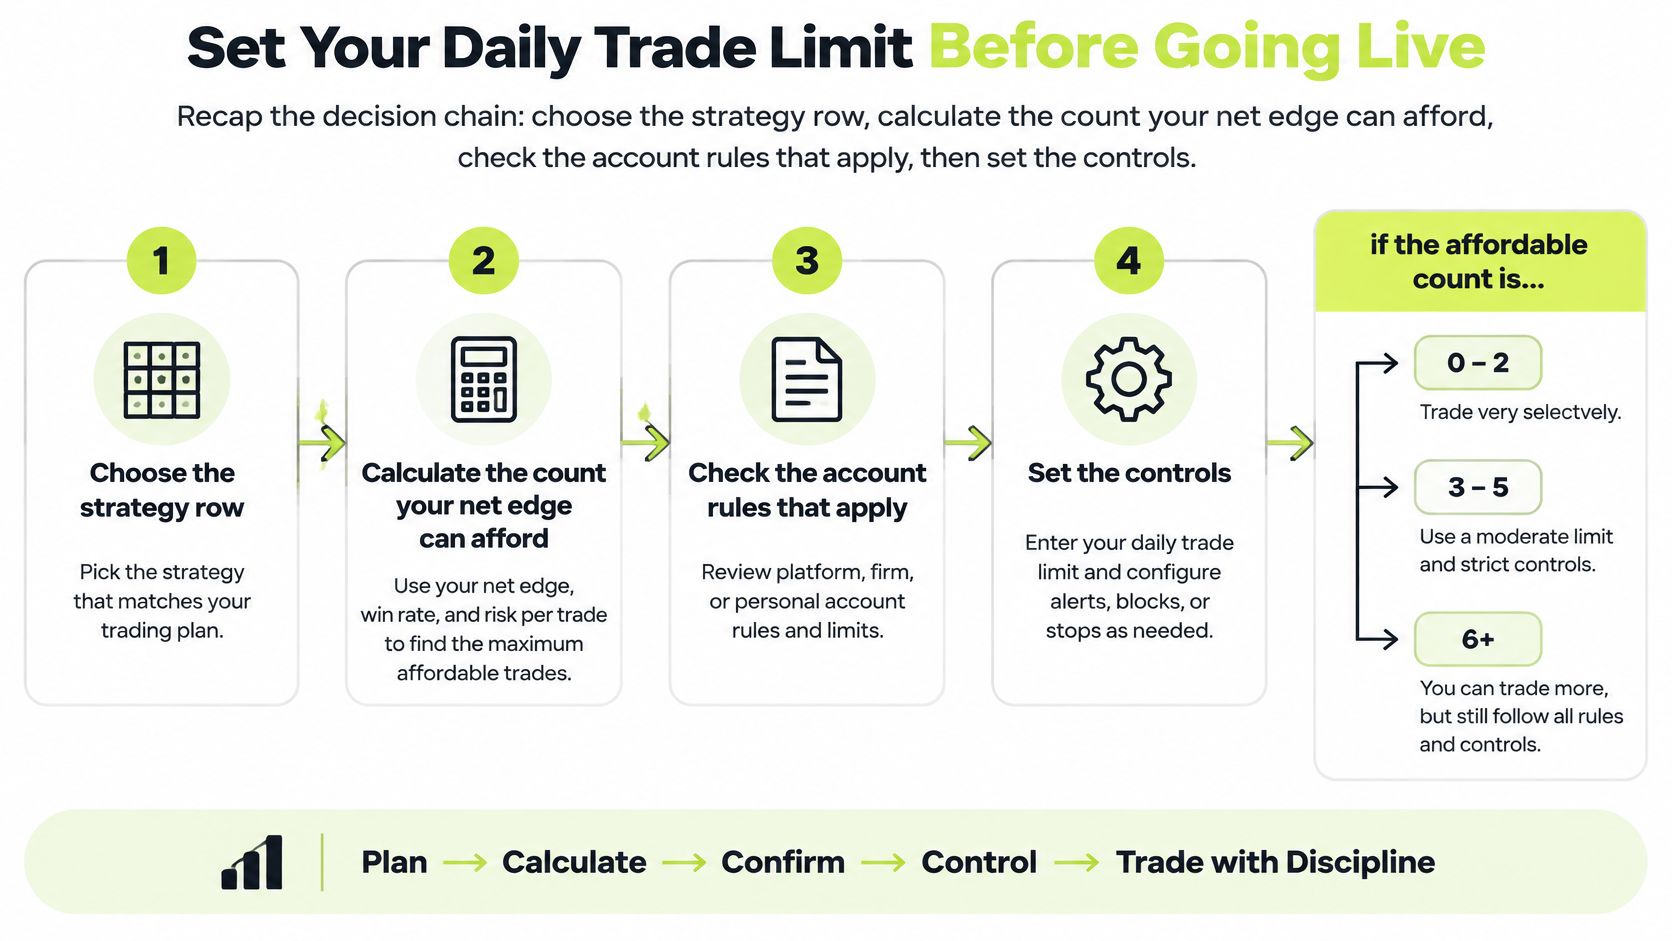
Your operating limit should be the lowest defensible boundary across strategy economics, historical activity, account permissions, and execution capacity. Don't select the largest number your broker or automation can technically accommodate.
If your planned activity exceeds that boundary, tighten the entry criteria and retest. Don't raise position size to compensate for fewer trades, because that changes the risk budget rather than solving the frequency problem.
Use this decision flow before configuring live execution.
Turn the ceiling into an enforceable rule
Define the counter. Specify which accepted opening events consume the daily allowance, when the counter resets, and how additional entries are treated. Use the same session definition in the backtest and live logic.
Block new entries without disabling risk reduction. Reaching the ceiling shouldn't prevent a valid exit. Keep the entry gate separate from position-management rules.
Start with test-mode records. Our workflow starts in test mode, where alerts are accepted and logged but never sent to the broker until you switch to live mode. Review sessions with quiet conditions, ordinary activity, and bursts rather than approving the setup after a single successful message.
Resolve non-trading alerts. When an alert arrives without an order, our signal log names the reason: paused, duplicate, test mode, plan needed, or Robinhood not connected. Classify the event before changing the script or attempting another submission.
Exercise the pause control. Verify that it blocks new entries, cancels entry orders originating from our automation, and keeps valid exits available. Confirm the resulting broker state rather than relying only on the button's appearance.
Measure delivery and execution separately. Record signal time, receipt time, order submission, broker acknowledgment, and fill details where available. A fast internal check doesn't establish a fast end-to-end fill.
Define acceptance before enabling live mode
A clean audit trail connects an event ID to its processing outcome and any resulting order history. Preserve status changes rather than overwriting them, and record a reason whenever an alert doesn't trade.
Set acceptance criteria before reviewing results. Require reconciled positions, explained rejections, understood duplicate handling, and event bursts comfortably within the capacity you've tested. Test mode can verify routing and decisions, but it can't prove live slippage or guarantee broker acceptance.
After going live, compare intended entries with accepted entries and actual fills. Revisit the ceiling when a script revision, changed session, or new instrument changes the distribution, not merely when the strategy has a disappointing day.
Write your entry limit and reset rule today, then reconcile them against the signal log after your first test session.
Pineflows turns TradingView strategy alerts into Robinhood market orders, with test-first operation and an auditable event trail. Visit Pineflows to configure your workflow, review incoming alerts in test mode, and verify your daily entry rules before enabling live execution.