November 5, 2026 · 11 min read · Pineflows team
How to Determine Stop Loss and Take Profit in 2026
You're staring at an order ticket with the entry filled in and two boxes still empty. One is the stop. One is the target. If you type a round price into either box because it feels far enough, the dollar risk and the chart level are two separate guesses, and they usually disagree.
How to determine stop loss and take profit starts with the distance to the price that proves the idea wrong. The share count comes from that distance and from a loss limit you already wrote down. The target comes last, and only if the chart can pay it. No method here guarantees a profit. A stop inside ordinary noise gets tagged. A target past the last swing rarely fills. A wide stop with a large position can erase a week of gains on one gap.
I would lock three numbers before the order goes in: the dollars you can lose, the price that kills the idea, and the reward that makes the trade worth taking.
Table of Contents
- Stop Loss Methods and When Each Fits
- Take Profit Targets and Reward-to-Risk Ratios
- How to Set Stop Loss and Take Profit in Six Steps
- Worked Example Sizing One Trade End to End
- Confirm Your Levels Before Going Live
Stop Loss Methods and When Each Fits
A fixed percentage stop is the simplest baseline. You place it 1% to 2% below entry and move on. It suits quick rules and large, stable names whose normal day is smaller than that band. It ignores volatility. A 2% stop on a stock that routinely travels 5% in a day is not risk control. It is a noise exit. You get stopped, the idea was still valid, and the next trade repeats the same error.
An ATR stop usually beats that fixed band when the name is jumpy. Average True Range over 14 periods measures how far price travels. On a daily chart, place the stop 1.5 to 3 times ATR beyond entry, and use a tighter multiple on an intraday chart, where the same multiple would be too wide for the session. The level moves with the instrument instead of with a percentage you picked last month. It still does not save you from a gap. Price can open through the ATR level, and the fill is worse than the line you drew.
Volatility bands are a cousin of this idea, not a substitute for it. The comparison of Keltner channels and Bollinger Bands shows two ways to see the same range. The stop still has to sit where the trade idea dies, not merely where a band line prints.
A structure stop sits just beyond the last swing low on a long, or the last swing high on a short. It fits when the chart shows a clear level. On a choppy chart that last swing can sit far away, so the stop is wide and the position has to shrink, or you skip the trade. A moving average stop, under a 20 or 50 period average, fits trend-following trades that should exit when the trend breaks. It lags. A fast reversal gives back more than a structure stop would have allowed.
Practical rule: Choose the method before entry and keep it the same on every position you want to compare. A 1% price stop on one name and a swing stop on the next makes the results unreadable.
| Method | How the level is set | Best for | Typical distance |
|---|---|---|---|
| Fixed percentage | 1% to 2% below entry | Quick rules and stable large caps | 1% to 2% of price |
| ATR multiple | 1.5 to 3 times the 14-period ATR beyond entry | Volatile markets and swing trades | Changes with volatility |
| Swing structure | Just beyond the last swing low or high | Trades with clear chart levels | Often wide on choppy charts |
| Moving average | Below a 20 or 50 period average | Trend-following trades | Changes with trend strength |
That 1% to 2% is a slice of price, not of the account. Gaps jump past every row in the table. The method only picks the invalidation price. Share count is what limits the dollars when the fill is worse than the line.
Take Profit Targets and Reward-to-Risk Ratios
One unit of R is the dollar amount between entry and the stop. A target at 2R pays twice that amount if it fills at the planned price. Break-even win rate equals risk divided by the sum of risk and reward. The table holds the figures so the text doesn't repeat them.
| Reward to risk | Break-even win rate | Win and loss on 100 dollars risked |
|---|---|---|
| 1:1 | 50% | A win pays 100 dollars and a loss costs 100 dollars |
| 1:2 | about 33% | A win pays 200 dollars and a loss costs 100 dollars |
| 1:3 | 25% | A win pays 300 dollars and a loss costs 100 dollars |
You can be profitable with a win rate under half when the winners are larger than the losers. You can lose money with a high win rate when each win is small next to a full loss. The win rate is not the score. The size of the wins against the losses is.
Three ways to place the target
Next prior resistance, or a measured move. Use the last swing the price has to clear, or project the prior impulse. This respects the chart. It fails when that level is only a small fraction of R away, because the trade then can't pay its own risk.
A fixed R multiple. You decide you want 2R or 3R, and you only take the trade if price can get there before obvious supply. Both exits belong on one ticket so the first fill cancels the other. A bracket order is the order type built for that pair.
A trailing exit. The stop moves up behind price on each new swing low or moving average, and it never moves down.
Commissions, spreads, and slippage raise the win rate you need. A 1:1.5 setup that looks fine on the chart can fail after those costs, because part of every winner is paid away before it reaches the account. Skip any trade where the nearest resistance gives less than the minimum ratio you set. If the room isn't there, the ticket isn't there.
How to Set Stop Loss and Take Profit in Six Steps
Run these six steps before the next order, in this order. The stop level and the account loss get decided together. Share count is the output, not the input.
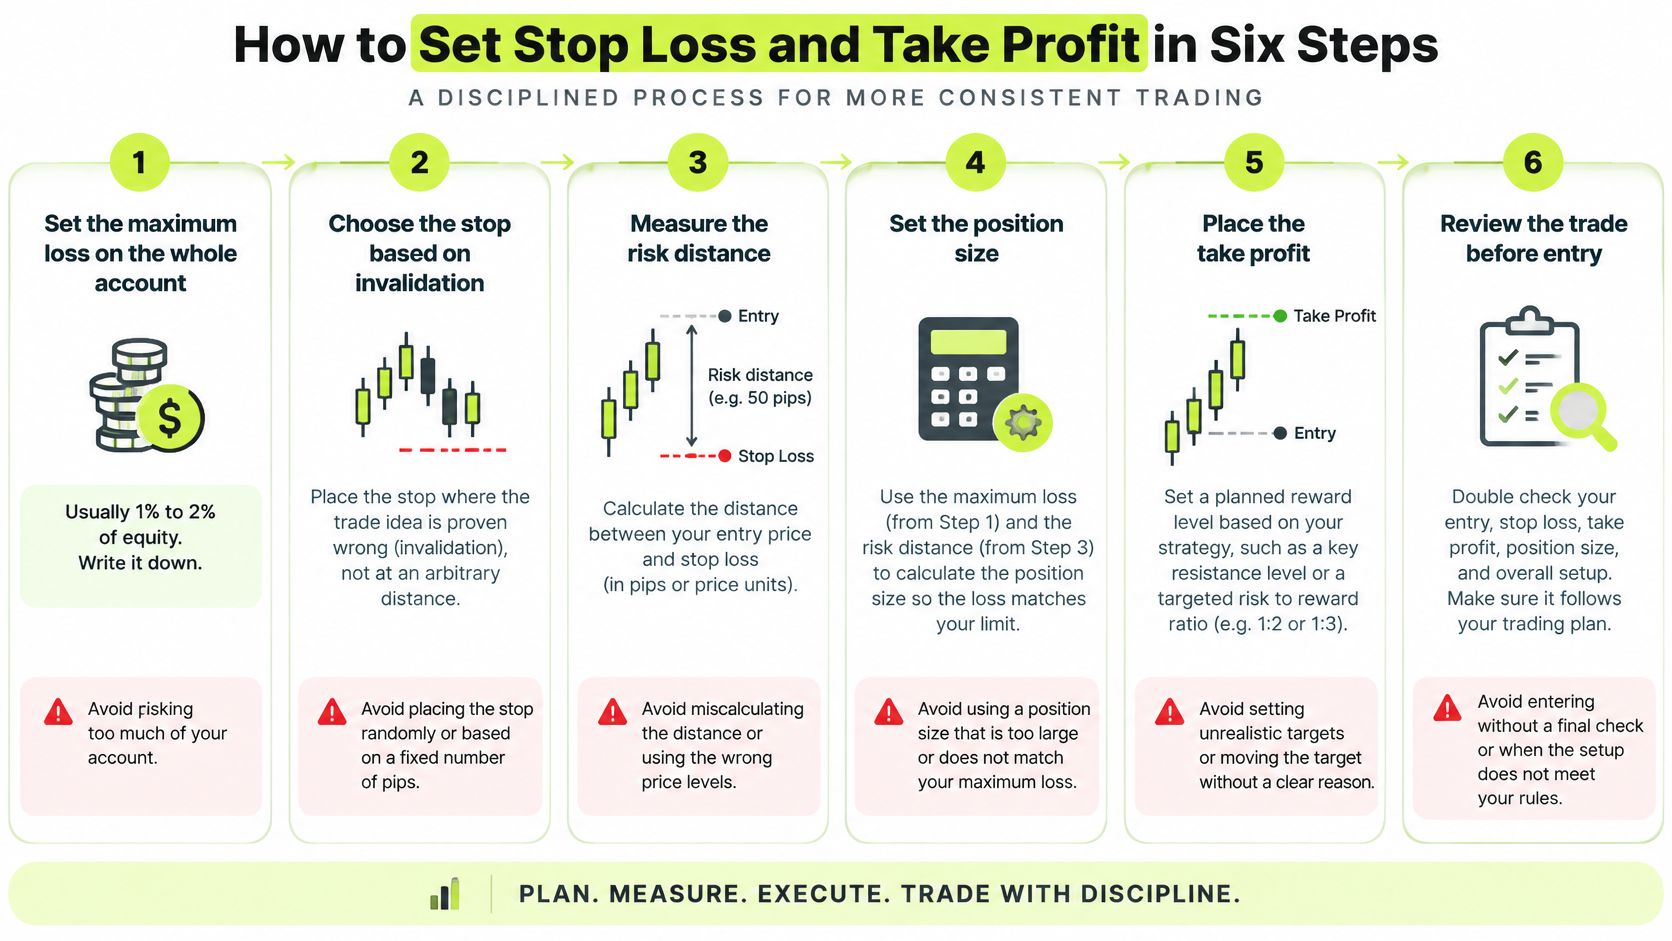
1. Write the maximum loss on the whole account. Use 1% to 2% of equity and write the dollar figure down before you open the chart. This is account risk, separate from the price-percent stop in the method table. The slip is sizing from a round lot because 100 shares looks tidy. The account doesn't care about tidy share counts.
2. Mark the price where the idea is wrong. That is the swing, the average the setup depends on, or the ATR multiple you already chose. Reason: the stop should be an invalidation, not a comfort level. The slip is parking it inside normal noise, such as half an ATR under entry, where ordinary bars will tag it.
3. Measure the entry-to-stop distance in dollars per share. Entry at 48.00 with a stop at 46.50 is 1.50 per share. That single number is the only input the next step needs. If you can't state it, you don't have a stop yet.
4. Divide the maximum loss by that distance and round down to whole shares. With a written loss of 100 dollars and a distance of 2.40, 100 divided by 2.40 is 41.67, so you buy 41 shares. Rounding up breaks the cap you just wrote. This is the step that ties the level and the dollars together.
5. Set the take profit at visible resistance or a fixed multiple such as 2R or 3R. Skip targets beyond the recent range. They look generous on the ticket and they rarely fill, so the trade becomes an open hold you didn't plan. If the realistic target is under your minimum multiple, pass.
6. Check the ratio against your minimum, then submit the stop and the target together. The expensive slip is widening the stop after entry to dodge a loss. That turns a planned 1% of equity into a loss you never sized. Move stops only toward the trade, never away from it.
Two risks that stack on the ticket
A gap can fill far below a stop, so keep size small enough that one bad open doesn't force you out of the next ten trades. Three tech names at 1% of equity each are one 3% bet if they move together. Cap total exposure across names that share the same driver, even when each ticket looks small on its own.
The honest ticket has one maximum loss, one target, and a ratio you accepted before entry. If any of those three is still a guess, don't send it.
Placing both exits on one ticket is easier to see than to describe, so this short clip is worth a look before you change a live order.
Worked Example Sizing One Trade End to End
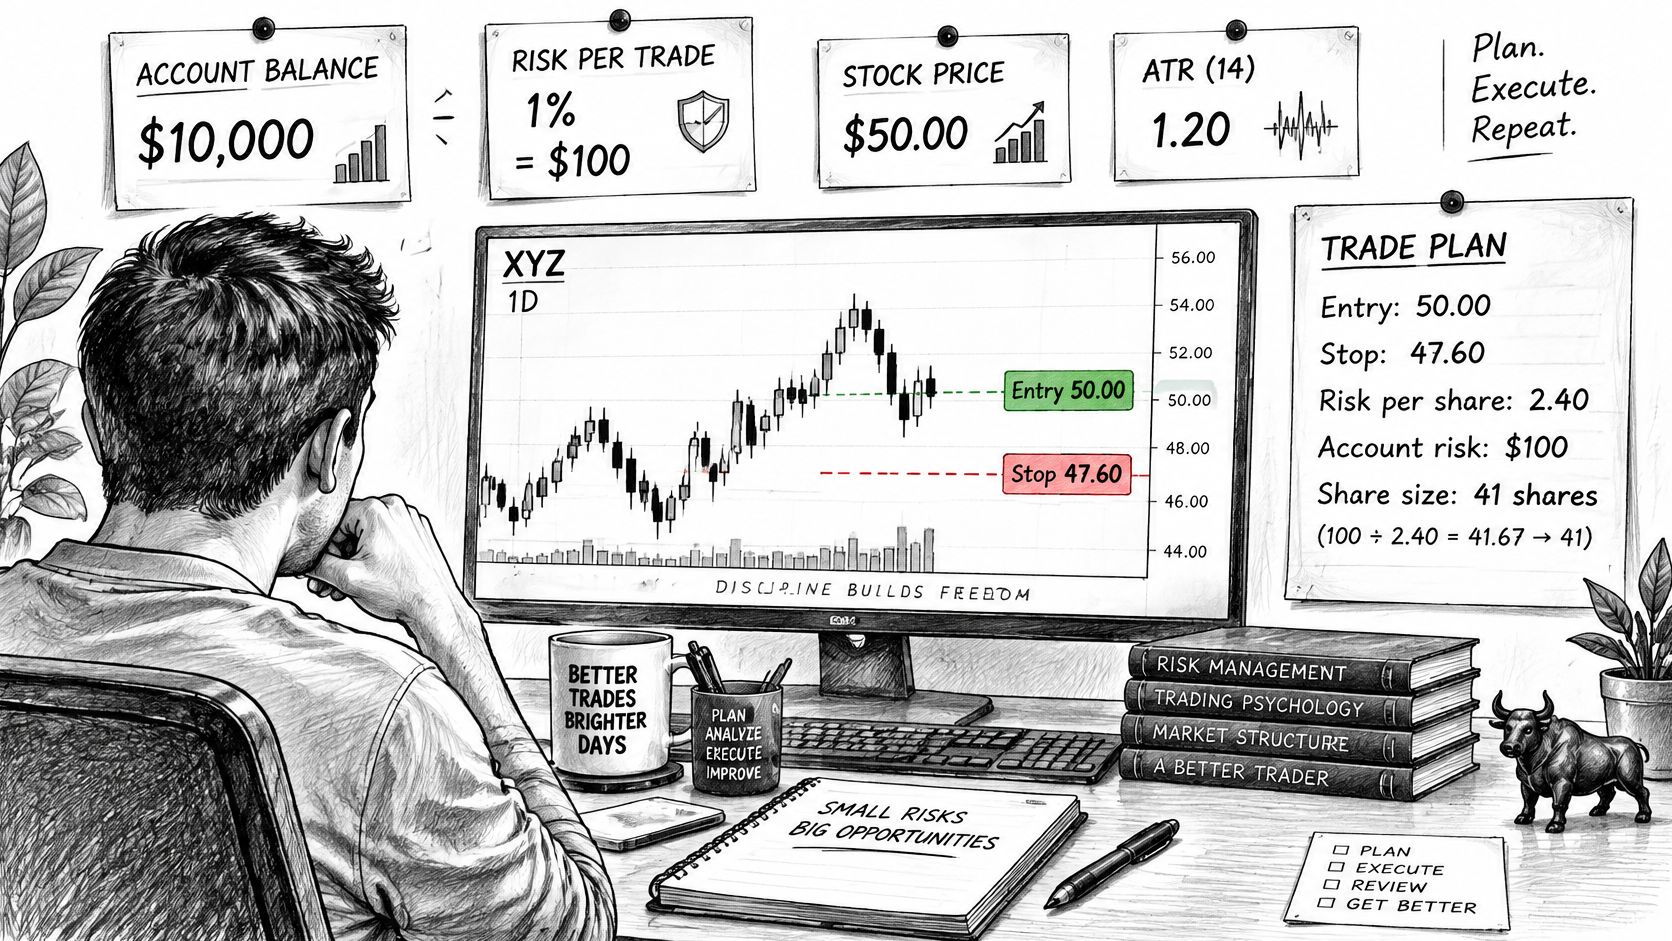
Say the account is 10,000 dollars and the maximum loss is 1%, which is 100 dollars. The stock trades at 50.00. The 14-period ATR is 1.20. You place the stop at 2 times ATR below entry.
Two times 1.20 is 2.40 dollars per share. Subtract that from 50.00 and the stop is 47.60.
Divide 100 by 2.40 and you get 41.67. Round down and buy 41 shares. Forty-one times 2.40 is 98.40 dollars at risk, just under the cap.
The target is 3R. Three times 2.40 is 7.20, so 50.00 plus 7.20 is 57.20. On 41 shares that is 295.20 dollars if it fills there, about 3:1 against the 98.40 at risk.
What changes when the stop tightens
Move the same stop to 1.5 times ATR. The distance shrinks to 1.80. Divide 100 by 1.80 and you get 55.55, so you buy 55 shares. Fifty-five times 1.80 is 99 dollars. The dollar risk stays near 100 dollars. The share count rose because the stop got closer, not because you got braver.
A tight stop with a large position is the same account risk as a wide stop with a small position. Sizing controls the loss. The stop line only tells you where the idea failed. Keep those 55 shares and then drag the stop out to 2.40, and you are no longer risking about 100 dollars. You are risking about 132, and the original cap is gone.
I would rather cut the share count than nudge the stop wider to give the trade room.
For futures or forex, convert the per-unit distance with the contract multiplier or the pip value before you divide. The dollars have to land on the planned figure, not on a raw point count that hides the multiplier.
| Item | Value |
|---|---|
| Account size | 10,000 dollars |
| Maximum loss (1%) | 100 dollars |
| Entry price | 50.00 |
| Stop distance per share | 2.40 dollars |
| Shares to buy | 41 |
| Target price (3R) | 57.20 |
| Reward to risk | about 3:1 |
The ticket to check is 41 shares at 50.00, stop 47.60, target 57.20, planned loss about 98 dollars.
Confirm Your Levels Before Going Live
The last check before an order leaves is the ticket itself. It has to match the stop distance that justified the position, because moving the stop changes the share count.
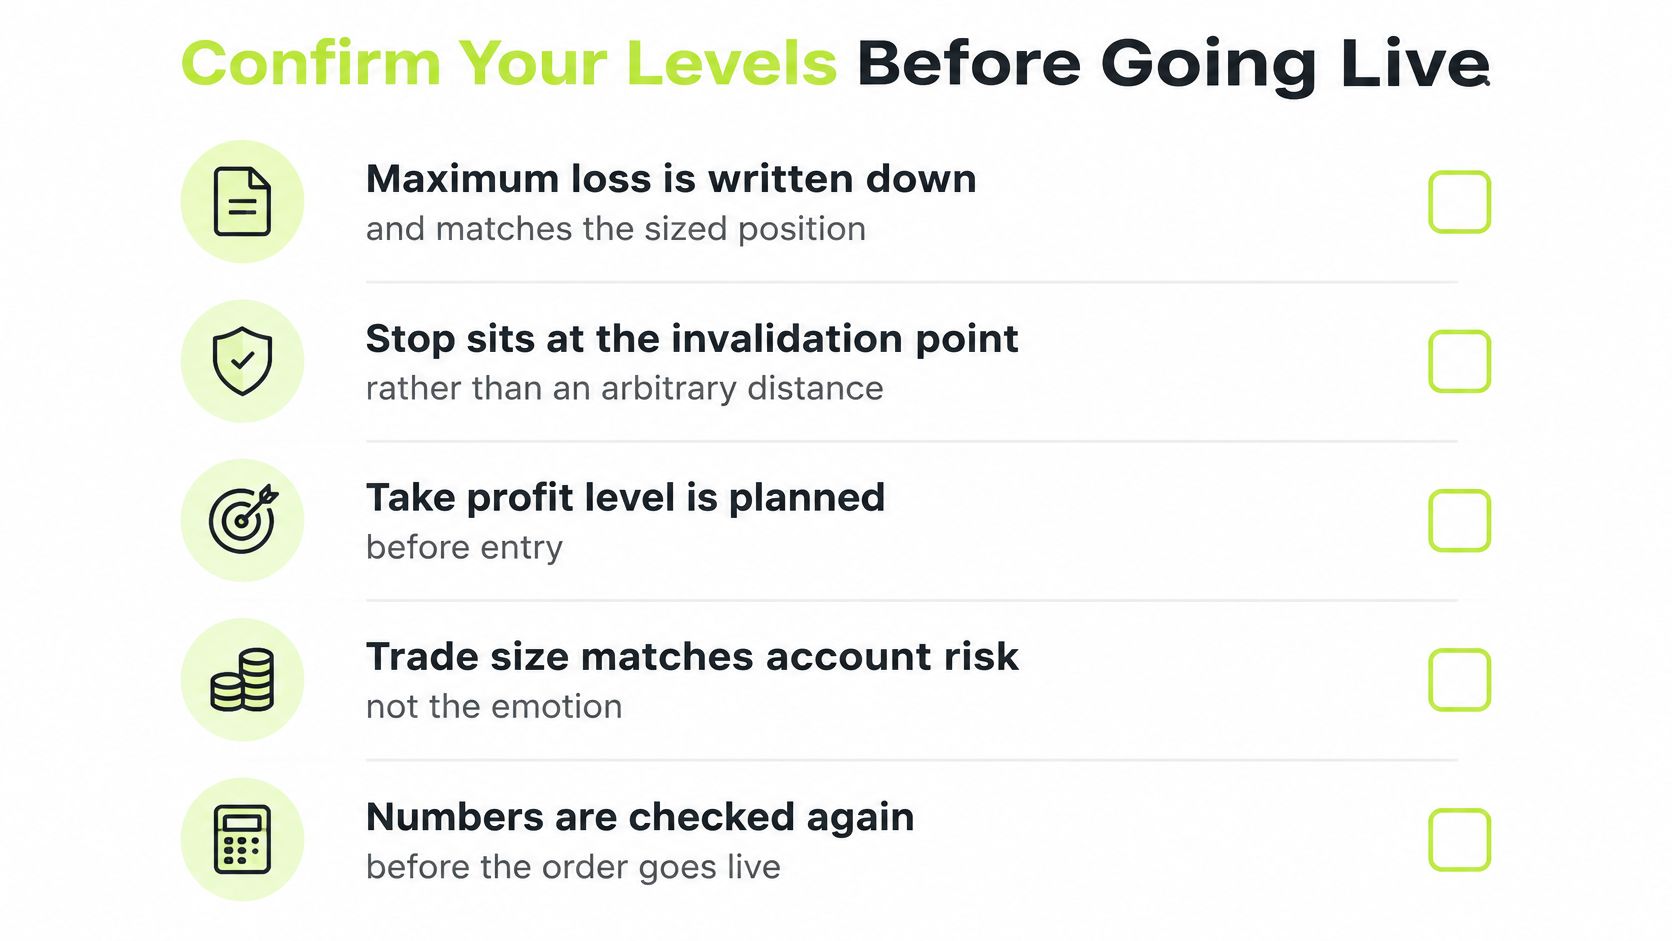
Run this checklist before each order. If one line fails, the order waits.
- Maximum loss is written down: the sized position matches that dollar figure, not a round lot you preferred.
- The stop sits at invalidation: it is the swing, average, or ATR multiple, not an arbitrary distance inside the noise.
- The target clears your minimum ratio: if the nearest realistic level doesn't, you skip the trade.
- Share count comes from the current stop: move the stop and you redo the division before you click.
- Gap risk fits this size: a name that can gap on earnings is a bigger risk than one that doesn't, so size it smaller.
Test the exits before they can spend money
The first run belongs in test mode, where alerts are logged and are not sent to the broker until you switch. Review that alert log before the switch, and compare the same exits with a backtest of the strategy so you know what the script did. Look for missed, duplicated, or late signals. The log should show the stop and target firing where the chart says they should.
Alerts can arrive late, twice, or not at all. Markets move while you wait, and brokers reject orders, so every automated exit still needs a manual check. If a signal is in the log and no order was placed, read the reason before you assume the stop is working. You approve the exact configuration before anything goes live, because an automated read of the script can be wrong.
Keep buying power and a valid Robinhood connection in place, and use a TradingView plan that can send webhooks. A broken connection turns a stop alert into a log entry.
A backtest is not a forecast. Pineflows is not investment advice, and trading involves the risk of loss. Software can send the order your rules describe. It can't make those rules profitable.
Pineflows takes alerts from a Pine Script strategy on TradingView and turns them into Robinhood orders, so the stop and target you already sized can leave the chart instead of waiting on a hand-typed ticket. You review the configuration, stay in test mode until the log looks right, and only then allow live orders. Visit Pineflows when you want that path from a planned exit to an actual order.